29
/
en
AIzaSyAYiBZKx7MnpbEhh9jyipgxe19OcubqV5w
April 1, 2024
61690
Upper middle income
UMC
false
2
1
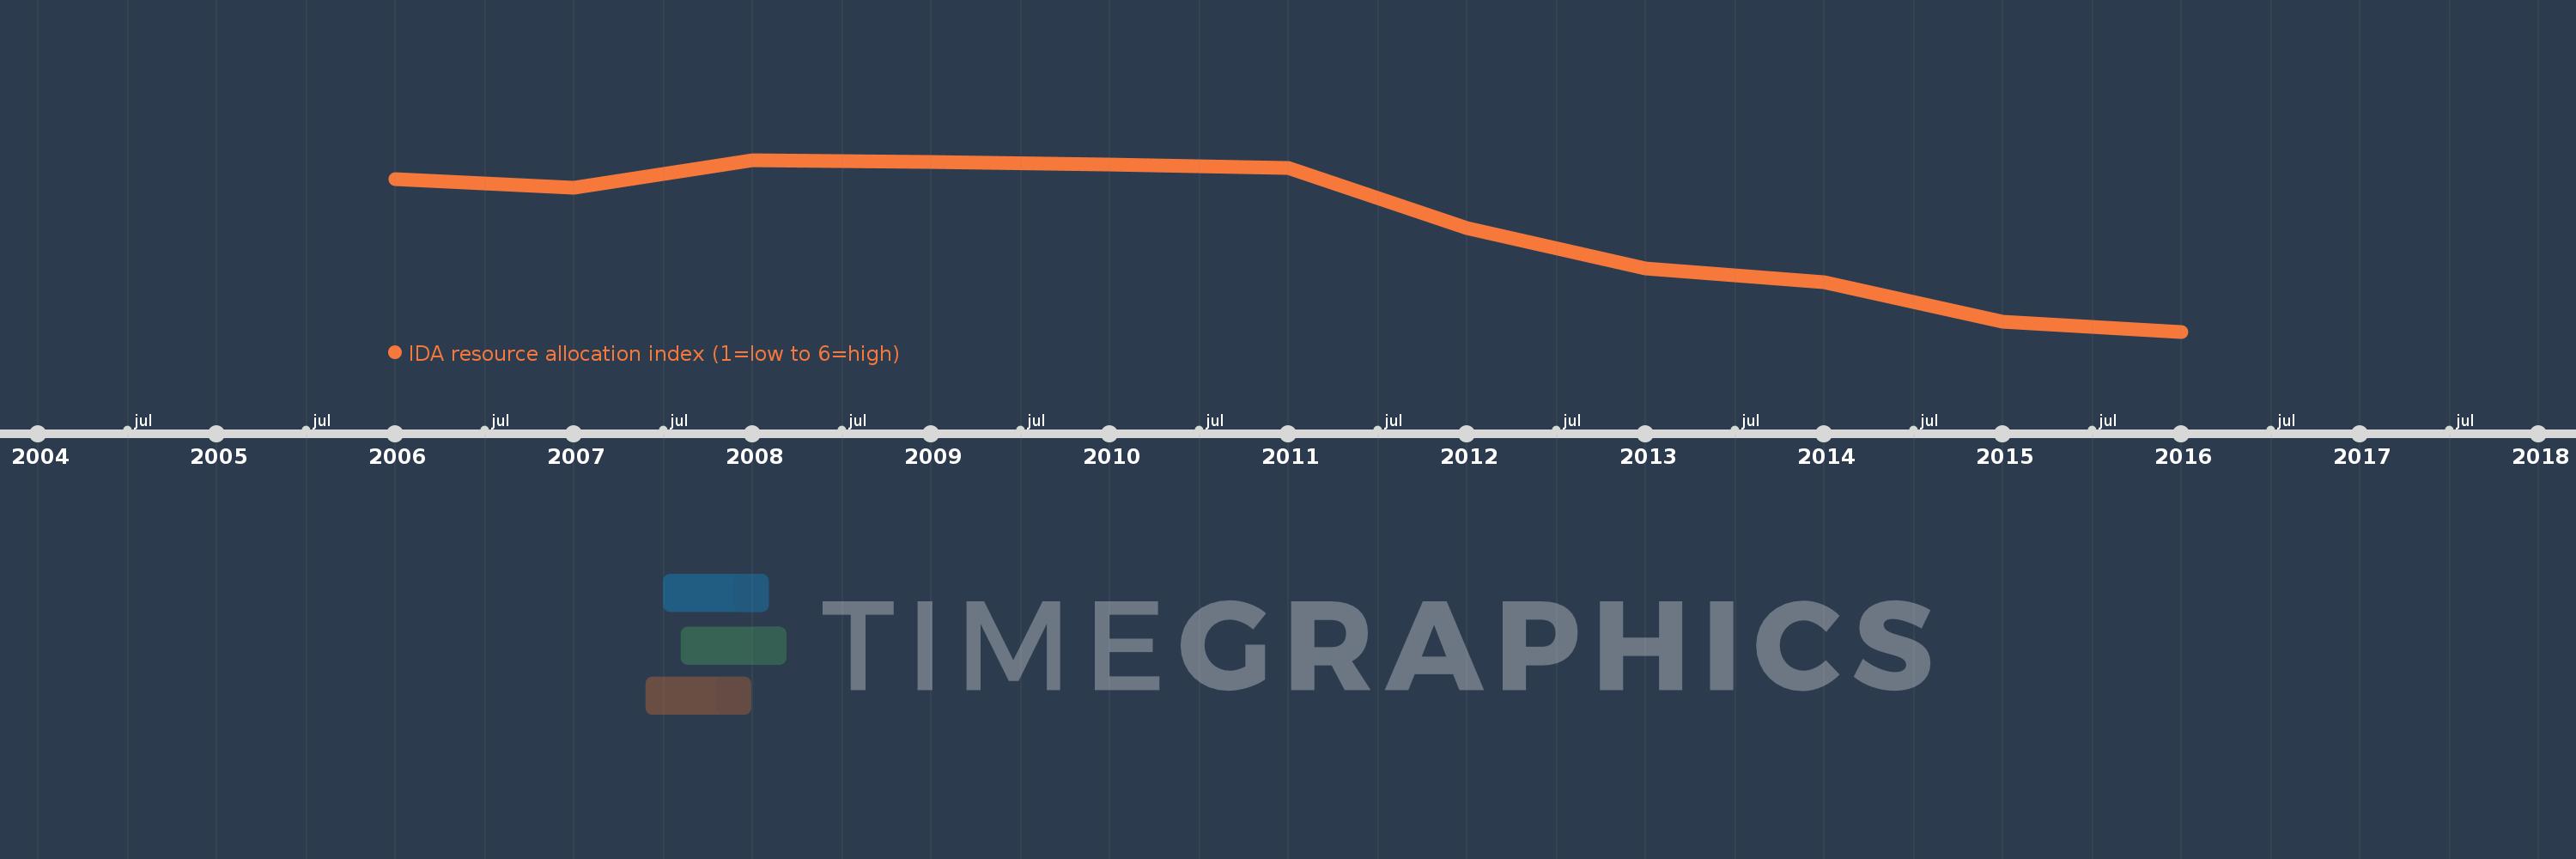
IDA resource allocation index (1=low to 6=high)
2016,2015,2014,2013,2012,2011,2010,2009,2008,2007,2006
This statistics in other country:
Timeline:
This timeline shows a graph from 2006 to 2016 of Upper middle income. No data until 2005. Number of actual observations by date: 11.
Source name:
World Development Indicators
Source organization:
World Bank Group, CPIA database (http://www.worldbank.org/ida).
Categories, topics:
Public Sector
Last updated:
apr 23, 2017
Indicators value changes by year
At the date of observation
Value
Absolute change
Change from previous value
jan 1, 2006
3.631
+3.631
0.0%
jan 1, 2007
3.612
-0.019
-0.54%
jan 1, 2008
3.674
+0.062
1.73%
jan 1, 2009
3.67
-0.004
-0.11%
jan 1, 2010
3.664
-0.006
-0.16%
jan 1, 2011
3.655
-0.009
-0.25%
jan 1, 2012
3.52
-0.135
-3.69%
jan 1, 2013
3.43
-0.09
-2.57%
jan 1, 2014
3.398
-0.031
-0.91%
jan 1, 2015
3.31
-0.088
-2.59%
jan 1, 2016
3.287
-0.023
-0.69%
Ranking of countries by current statistics by years


Comments: