29
/
en
AIzaSyAYiBZKx7MnpbEhh9jyipgxe19OcubqV5w
April 1, 2024
60512
Sub-Saharan Africa (IDA & IBRD countries)
TSS
false
2
1
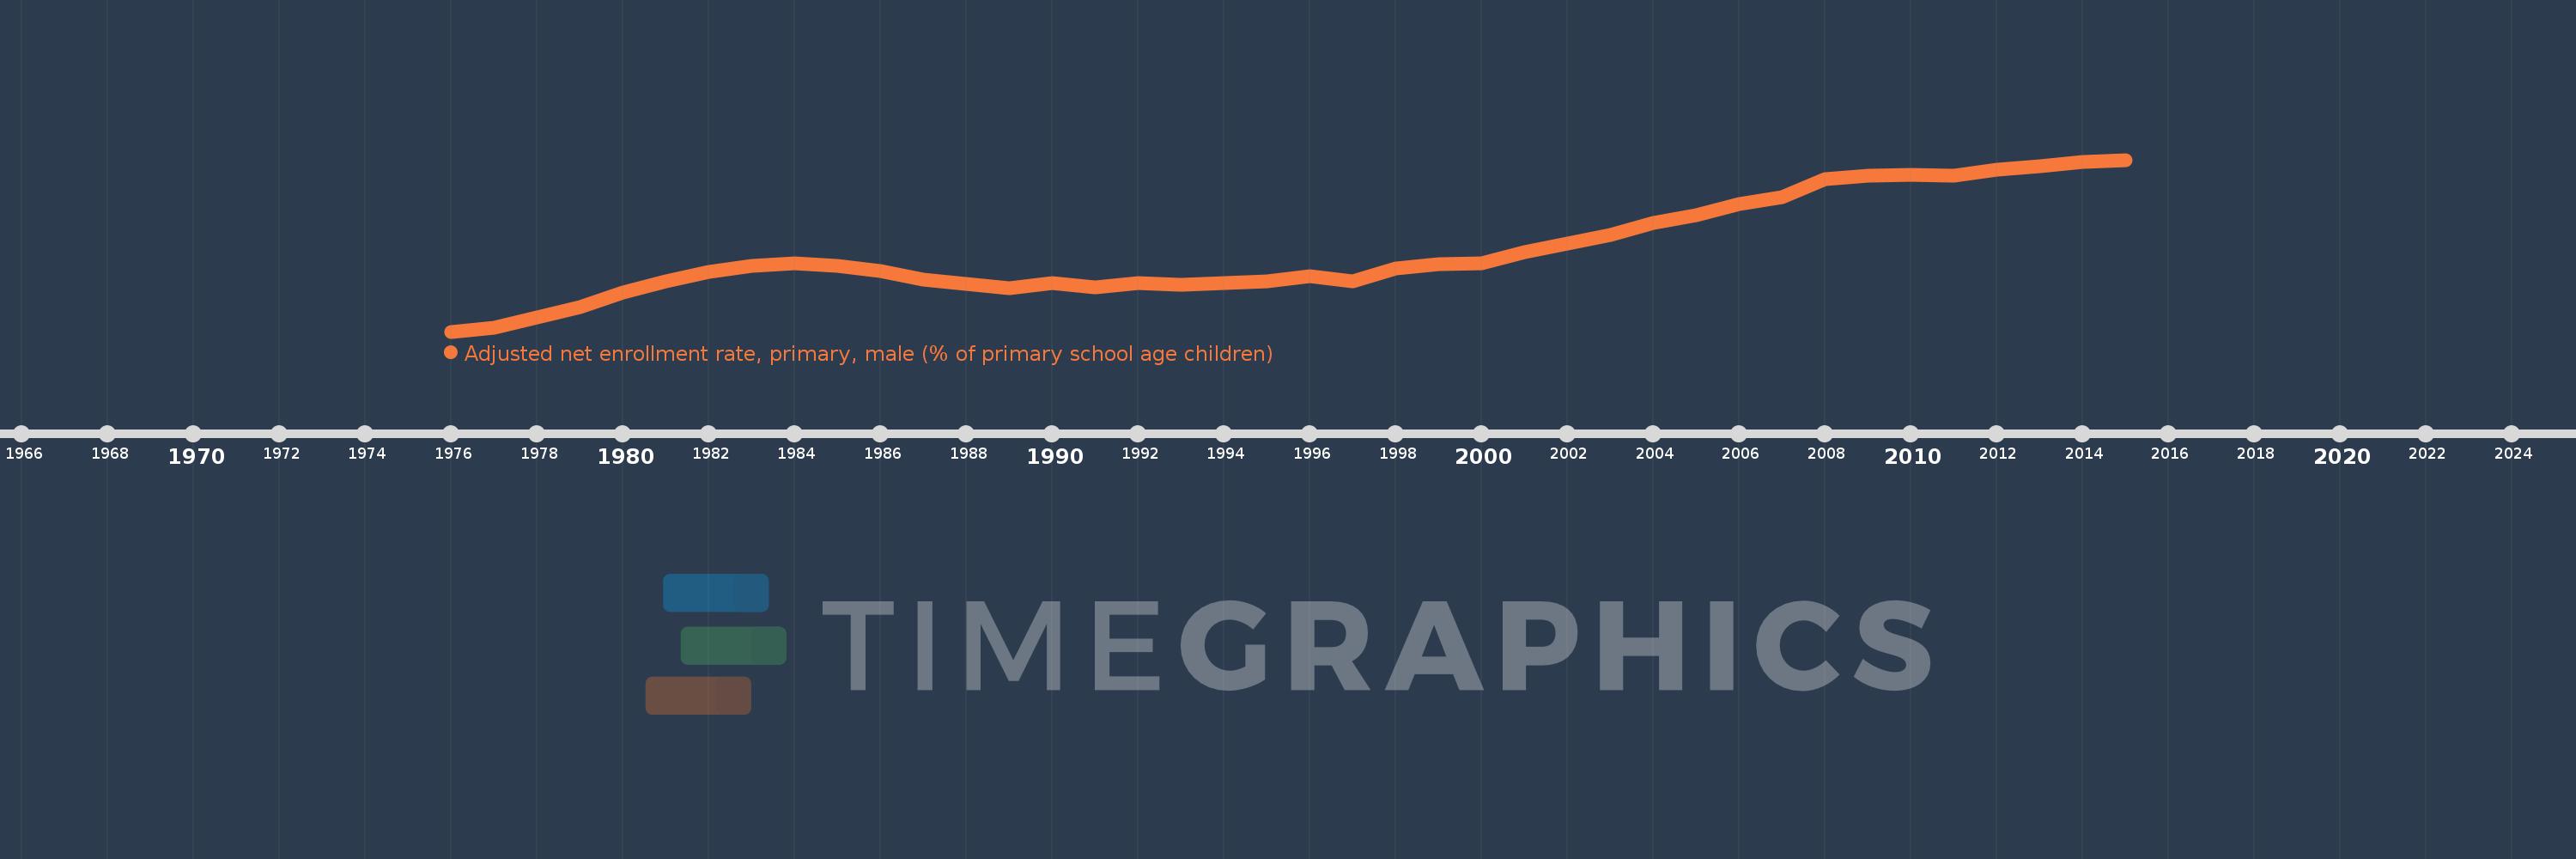
Adjusted net enrollment rate, primary, male (% of primary school age children)
2015,2014,2013,2012,2011,2010,2009,2008,2007,2006,2005,2004,2003,2002,2001,2000,1999,1998,1997,1996,1995,1994,1993,1992,1991,1990,1989,1988,1987,1986,1985,1984,1983,1982,1981,1980,1979,1978,1977,1976
This statistics in other country:
AfghanistanAlbaniaAlgeriaAngolaAntigua and BarbudaArab WorldArgentinaArmeniaArubaAustraliaAustriaAzerbaijanBahamas, TheBahrainBangladeshBarbadosBelarusBelgiumBelizeBeninBermudaBhutanBoliviaBosnia and HerzegovinaBotswanaBrazilBrunei DarussalamBulgariaBurkina FasoBurundiCabo VerdeCambodiaCameroonCanadaCaribbean small statesCentral African RepublicCentral Europe and the BalticsChadChileChinaColombiaComorosCongo, Dem. Rep.Congo, Rep.Costa RicaCote d'IvoireCroatiaCubaCyprusDenmarkDjiboutiDominicaDominican RepublicEarly-demographic dividendEast Asia & PacificEast Asia & Pacific (excluding high income)East Asia & Pacific (IDA & IBRD countries)EcuadorEgypt, Arab Rep.El SalvadorEquatorial GuineaEritreaEstoniaEthiopiaEuro areaEurope & Central AsiaEurope & Central Asia (excluding high income)Europe & Central Asia (IDA & IBRD countries)European UnionFijiFinlandFragile and conflict affected situationsFranceGabonGambia, TheGeorgiaGhanaGreeceGrenadaGuatemalaGuineaGuinea-BissauGuyanaHaitiHeavily indebted poor countries (HIPC)High incomeHondurasHong Kong SAR, ChinaHungaryIBRD onlyIcelandIDA & IBRD totalIDA blendIDA onlyIDA totalIndiaIndonesiaIran, Islamic Rep.IraqIrelandIsraelItalyJamaicaJapanJordanKazakhstanKenyaKiribatiKorea, Dem. People’s Rep.Korea, Rep.KuwaitKyrgyz RepublicLao PDRLate-demographic dividendLatin America & Caribbean Latin America & Caribbean (excluding high income)Latin America & the Caribbean (IDA & IBRD countries)LatviaLeast developed countries: UN classificationLebanonLesothoLiberiaLibyaLiechtensteinLithuaniaLow & middle incomeLow incomeLower middle incomeLuxembourgMacao SAR, ChinaMacedonia, FYRMadagascarMalawiMaldivesMaliMaltaMarshall IslandsMauritaniaMauritiusMexicoMicronesia, Fed. Sts.Middle East & North AfricaMiddle East & North Africa (excluding high income)Middle East & North Africa (IDA & IBRD countries)Middle incomeMoldovaMongoliaMontenegroMoroccoMozambiqueMyanmarNamibiaNauruNepalNetherlandsNew ZealandNicaraguaNigerNigeriaNorth AmericaNorwayOECD membersOmanOther small statesPacific island small statesPakistanPanamaPapua New GuineaParaguayPeruPhilippinesPolandPortugalPost-demographic dividendPre-demographic dividendPuerto RicoQatarRomaniaRussian FederationRwandaSamoaSan MarinoSao Tome and PrincipeSaudi ArabiaSenegalSerbiaSeychellesSierra LeoneSloveniaSmall statesSolomon IslandsSomaliaSouth AfricaSouth AsiaSouth Asia (IDA & IBRD)South SudanSpainSri LankaSt. Kitts and NevisSt. LuciaSt. Vincent and the GrenadinesSub-Saharan Africa Sub-Saharan Africa (excluding high income)Sub-Saharan Africa (IDA & IBRD countries)SudanSurinameSwazilandSwedenSwitzerlandSyrian Arab RepublicTajikistanTanzaniaThailandTimor-LesteTogoTongaTrinidad and TobagoTunisiaTurkeyTuvaluUgandaUkraineUnited Arab EmiratesUnited KingdomUnited StatesUpper middle incomeUruguayUzbekistanVanuatuVenezuela, RBWest Bank and GazaWorldYemen, Rep.ZambiaZimbabwe Timeline:
This timeline shows a graph from 1976 to 2015 of Sub-Saharan Africa (IDA & IBRD countries). No data until 1975. Number of actual observations by date: 40.
Source name:
World Development Indicators
Source organization:
United Nations Educational, Scientific, and Cultural Organization (UNESCO) Institute for Statistics.
Categories, topics:
Education, Gender
Last updated:
apr 23, 2017
Indicators value changes by year
Minimum:
49.147
jan 1, 1976
At the date of observation
Value
Absolute change
Change from previous value
jan 1, 1976
49.147
+49.147
0.0%
jan 1, 1977
49.887
+0.74
1.51%
jan 1, 1978
51.703
+1.816
3.64%
jan 1, 1979
53.656
+1.953
3.78%
jan 1, 1980
56.301
+2.645
4.93%
jan 1, 1981
58.333
+2.033
3.61%
jan 1, 1982
60.173
+1.84
3.15%
jan 1, 1983
61.293
+1.12
1.86%
jan 1, 1984
61.765
+0.472
0.77%
jan 1, 1985
61.245
-0.52
-0.84%
jan 1, 1986
60.233
-1.012
-1.65%
jan 1, 1987
58.754
-1.48
-2.46%
jan 1, 1988
57.892
-0.861
-1.47%
jan 1, 1989
57.151
-0.741
-1.28%
jan 1, 1990
58.011
+0.86
1.5%
jan 1, 1991
57.367
-0.643
-1.11%
jan 1, 1992
58.116
+0.748
1.3%
jan 1, 1993
57.728
-0.388
-0.67%
jan 1, 1994
58.043
+0.315
0.55%
jan 1, 1995
58.341
+0.298
0.51%
jan 1, 1996
59.362
+1.021
1.75%
jan 1, 1997
58.432
-0.93
-1.57%
jan 1, 1998
60.778
+2.345
4.01%
jan 1, 1999
61.567
+0.789
1.3%
jan 1, 2000
61.775
+0.208
0.34%
jan 1, 2001
63.828
+2.053
3.32%
jan 1, 2002
65.389
+1.562
2.45%
jan 1, 2003
66.889
+1.499
2.29%
jan 1, 2004
69.092
+2.204
3.29%
jan 1, 2005
70.518
+1.425
2.06%
jan 1, 2006
72.611
+2.093
2.97%
jan 1, 2007
73.985
+1.374
1.89%
jan 1, 2008
77.197
+3.212
4.34%
jan 1, 2009
77.852
+0.656
0.85%
jan 1, 2010
78.002
+0.15
0.19%
jan 1, 2011
77.784
-0.218
-0.28%
jan 1, 2012
78.96
+1.177
1.51%
jan 1, 2013
79.613
+0.653
0.83%
jan 1, 2014
80.343
+0.73
0.92%
jan 1, 2015
80.79
+0.447
0.56%
Ranking of countries by current statistics by years


Comments: