29
/
en
AIzaSyAYiBZKx7MnpbEhh9jyipgxe19OcubqV5w
April 1, 2024
59048
Sub-Saharan Africa
SSF
false
2
1
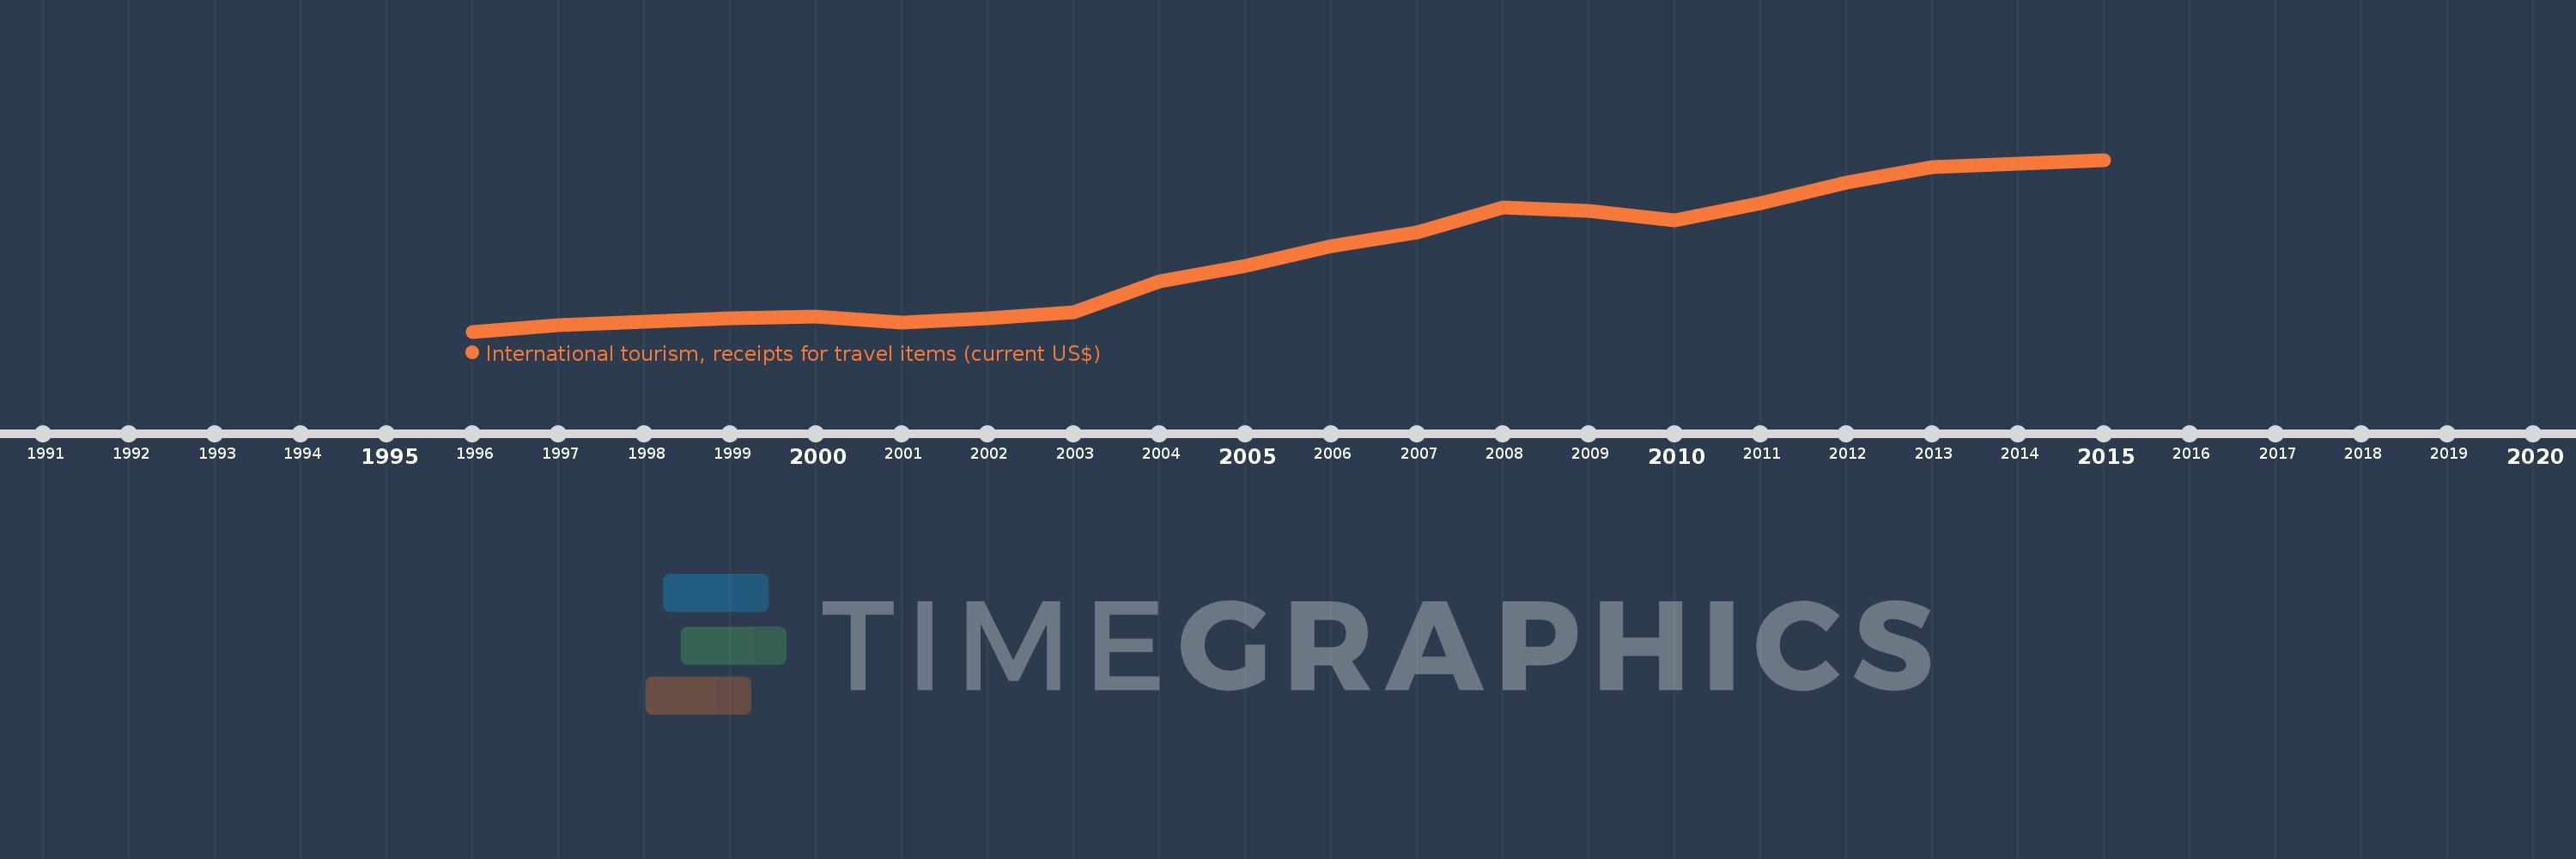
International tourism, receipts for travel items (current US$)
2015,2014,2013,2012,2011,2010,2009,2008,2007,2006,2005,2004,2003,2002,2001,2000,1999,1998,1997,1996
This statistics in other country:
AfghanistanAlbaniaAlgeriaAngolaAntigua and BarbudaArab WorldArgentinaArmeniaArubaAustraliaAustriaAzerbaijanBahamas, TheBahrainBangladeshBarbadosBelarusBelgiumBelizeBeninBermudaBhutanBoliviaBosnia and HerzegovinaBotswanaBrazilBrunei DarussalamBulgariaBurkina FasoBurundiCabo VerdeCambodiaCameroonCanadaCaribbean small statesCentral African RepublicCentral Europe and the BalticsChileChinaColombiaComorosCongo, Dem. Rep.Congo, Rep.Costa RicaCote d'IvoireCroatiaCubaCuracaoCyprusCzech RepublicDenmarkDjiboutiDominicaDominican RepublicEarly-demographic dividendEast Asia & PacificEast Asia & Pacific (excluding high income)East Asia & Pacific (IDA & IBRD countries)EcuadorEgypt, Arab Rep.El SalvadorEstoniaEthiopiaEuro areaEurope & Central AsiaEurope & Central Asia (excluding high income)Europe & Central Asia (IDA & IBRD countries)European UnionFijiFinlandFragile and conflict affected situationsFranceFrench PolynesiaGabonGambia, TheGeorgiaGermanyGhanaGreeceGrenadaGuatemalaGuineaGuinea-BissauGuyanaHaitiHeavily indebted poor countries (HIPC)High incomeHondurasHong Kong SAR, ChinaHungaryIBRD onlyIcelandIDA & IBRD totalIDA blendIDA onlyIDA totalIndiaIndonesiaIran, Islamic Rep.IraqIrelandIsraelItalyJamaicaJapanJordanKazakhstanKenyaKiribatiKorea, Rep.KuwaitKyrgyz RepublicLao PDRLate-demographic dividendLatin America & Caribbean Latin America & Caribbean (excluding high income)Latin America & the Caribbean (IDA & IBRD countries)LatviaLeast developed countries: UN classificationLebanonLesothoLiberiaLibyaLithuaniaLow & middle incomeLower middle incomeLuxembourgMacao SAR, ChinaMacedonia, FYRMadagascarMalawiMalaysiaMaldivesMaliMaltaMarshall IslandsMauritaniaMauritiusMexicoMicronesia, Fed. Sts.Middle East & North AfricaMiddle East & North Africa (excluding high income)Middle East & North Africa (IDA & IBRD countries)Middle incomeMoldovaMongoliaMontenegroMoroccoMozambiqueMyanmarNamibiaNepalNetherlandsNew CaledoniaNew ZealandNicaraguaNigerNigeriaNorth AmericaNorwayOECD membersOmanPacific island small statesPakistanPalauPanamaPapua New GuineaParaguayPeruPhilippinesPolandPortugalPost-demographic dividendPre-demographic dividendQatarRomaniaRussian FederationRwandaSamoaSao Tome and PrincipeSaudi ArabiaSenegalSerbiaSeychellesSierra LeoneSingaporeSint Maarten (Dutch part)Slovak RepublicSloveniaSolomon IslandsSouth AfricaSouth AsiaSouth Asia (IDA & IBRD)SpainSri LankaSt. Kitts and NevisSt. LuciaSt. Vincent and the GrenadinesSub-Saharan Africa Sub-Saharan Africa (excluding high income)Sub-Saharan Africa (IDA & IBRD countries)SudanSurinameSwazilandSwedenSwitzerlandSyrian Arab RepublicTajikistanTanzaniaThailandTimor-LesteTogoTongaTrinidad and TobagoTunisiaTurkeyTurkmenistanTuvaluUgandaUkraineUnited KingdomUnited StatesUpper middle incomeUruguayUzbekistanVanuatuVenezuela, RBWest Bank and GazaWorldYemen, Rep.Zambia Timeline:
This timeline shows a graph from 1996 to 2015 of Sub-Saharan Africa . No data until 1995. Number of actual observations by date: 20.
Source name:
World Development Indicators
Source organization:
World Tourism Organization, Yearbook of Tourism Statistics, Compendium of Tourism Statistics and data files.
Categories, topics:
Private Sector, Trade
Last updated:
apr 23, 2017
Indicators value changes by year
Minimum:
5.538 bln
jan 1, 1996
Maximum:
27.431 bln
jan 1, 2015
At the date of observation
Value
Absolute change
Change from previous value
jan 1, 1996
5.538 bln
+5.538 bln
0.0%
jan 1, 1997
6.318 bln
+779.391 mln
14.07%
jan 1, 1998
6.768 bln
+450.055 mln
7.12%
jan 1, 1999
7.288 bln
+520.611 mln
7.69%
jan 1, 2000
7.48 bln
+191.837 mln
2.63%
jan 1, 2001
6.705 bln
-775.239 mln
-10.36%
jan 1, 2002
7.224 bln
+519.123 mln
7.74%
jan 1, 2003
7.961 bln
+736.356 mln
10.19%
jan 1, 2004
11.921 bln
+3.96 bln
49.75%
jan 1, 2005
13.878 bln
+1.957 bln
16.41%
jan 1, 2006
16.415 bln
+2.538 bln
18.29%
jan 1, 2007
18.181 bln
+1.766 bln
10.76%
jan 1, 2008
21.377 bln
+3.195 bln
17.58%
jan 1, 2009
20.882 bln
-494.71 mln
-2.31%
jan 1, 2010
19.706 bln
-1.176 bln
-5.63%
jan 1, 2011
21.914 bln
+2.209 bln
11.21%
jan 1, 2012
24.557 bln
+2.642 bln
12.06%
jan 1, 2013
26.499 bln
+1.942 bln
7.91%
jan 1, 2014
26.948 bln
+448.502 mln
1.69%
jan 1, 2015
27.431 bln
+483.465 mln
1.79%
Ranking of countries by current statistics by years


Comments: