29
/
en
AIzaSyAYiBZKx7MnpbEhh9jyipgxe19OcubqV5w
April 1, 2024
58186
South Asia (IDA & IBRD)
TSA
false
2
1
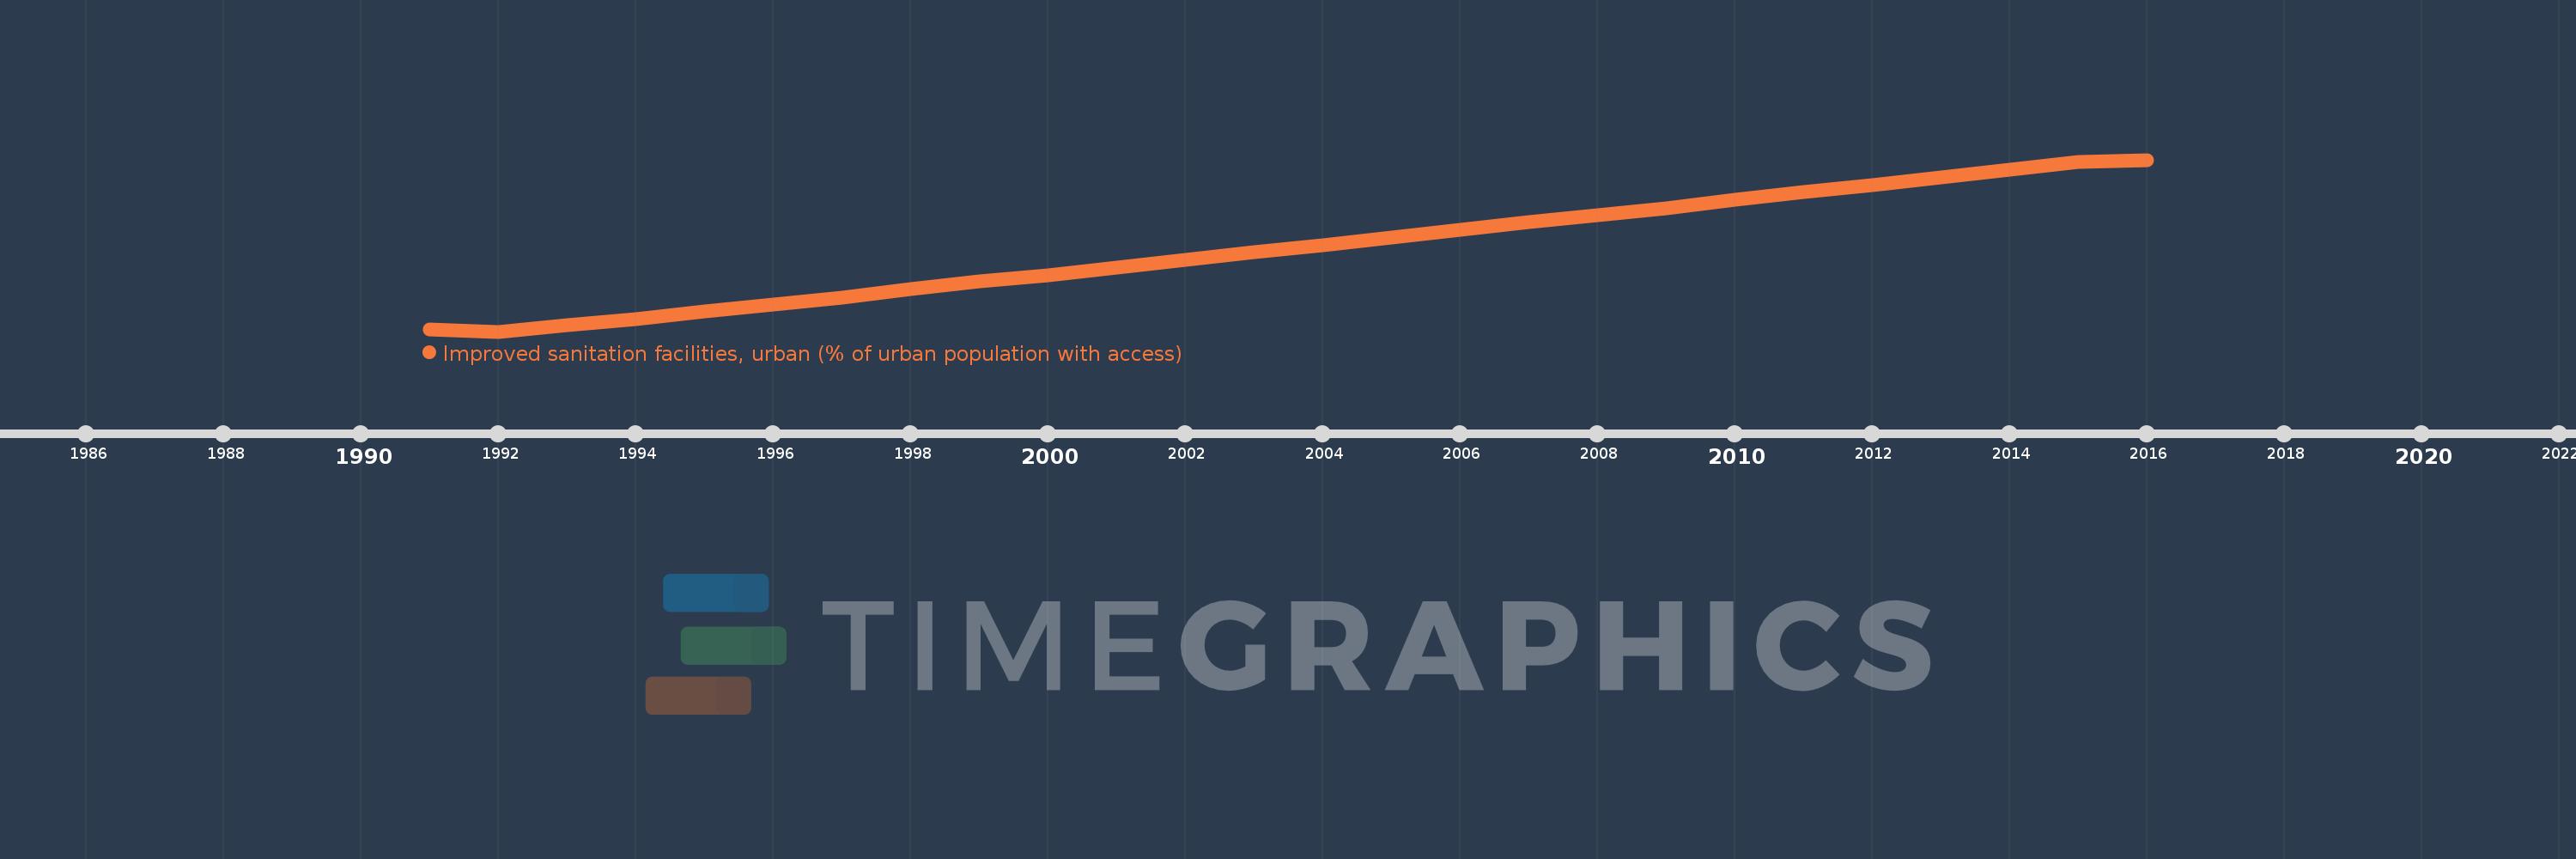
Improved sanitation facilities, urban (% of urban population with access)
2016,2015,2014,2013,2012,2011,2010,2009,2008,2007,2006,2005,2004,2003,2002,2001,2000,1999,1998,1997,1996,1995,1994,1993,1992,1991
This statistics in other country:
AfghanistanAlbaniaAlgeriaAmerican SamoaAndorraAngolaAntigua and BarbudaArab WorldArgentinaArmeniaArubaAustraliaAustriaAzerbaijanBahamas, TheBahrainBangladeshBarbadosBelarusBelgiumBelizeBeninBhutanBoliviaBosnia and HerzegovinaBotswanaBrazilBritish Virgin IslandsBulgariaBurkina FasoBurundiCabo VerdeCambodiaCameroonCanadaCaribbean small statesCayman IslandsCentral African RepublicCentral Europe and the BalticsChadChileChinaColombiaComorosCongo, Dem. Rep.Congo, Rep.Costa RicaCote d'IvoireCroatiaCubaCyprusCzech RepublicDenmarkDjiboutiDominicaDominican RepublicEarly-demographic dividendEast Asia & PacificEast Asia & Pacific (excluding high income)East Asia & Pacific (IDA & IBRD countries)EcuadorEgypt, Arab Rep.El SalvadorEquatorial GuineaEritreaEstoniaEthiopiaEuro areaEurope & Central AsiaEurope & Central Asia (excluding high income)Europe & Central Asia (IDA & IBRD countries)European UnionFijiFinlandFragile and conflict affected situationsFranceFrench PolynesiaGabonGambia, TheGeorgiaGermanyGhanaGreeceGreenlandGrenadaGuamGuatemalaGuineaGuinea-BissauGuyanaHaitiHeavily indebted poor countries (HIPC)High incomeHondurasHungaryIBRD onlyIcelandIDA & IBRD totalIDA blendIDA onlyIDA totalIndiaIndonesiaIran, Islamic Rep.IraqIrelandIsraelItalyJamaicaJapanJordanKazakhstanKenyaKiribatiKorea, Dem. People’s Rep.Korea, Rep.KuwaitKyrgyz RepublicLao PDRLate-demographic dividendLatin America & Caribbean Latin America & Caribbean (excluding high income)Latin America & the Caribbean (IDA & IBRD countries)LatviaLeast developed countries: UN classificationLebanonLesothoLiberiaLibyaLithuaniaLow & middle incomeLow incomeLower middle incomeLuxembourgMacedonia, FYRMadagascarMalawiMalaysiaMaldivesMaliMaltaMarshall IslandsMauritaniaMauritiusMexicoMicronesia, Fed. Sts.Middle East & North AfricaMiddle East & North Africa (excluding high income)Middle East & North Africa (IDA & IBRD countries)Middle incomeMoldovaMonacoMongoliaMontenegroMoroccoMozambiqueMyanmarNamibiaNauruNepalNetherlandsNew CaledoniaNicaraguaNigerNigeriaNorth AmericaNorthern Mariana IslandsNorwayOECD membersOmanOther small statesPacific island small statesPakistanPalauPanamaPapua New GuineaParaguayPeruPhilippinesPolandPortugalPost-demographic dividendPre-demographic dividendPuerto RicoQatarRomaniaRussian FederationRwandaSamoaSao Tome and PrincipeSaudi ArabiaSenegalSerbiaSeychellesSierra LeoneSingaporeSlovak RepublicSloveniaSmall statesSolomon IslandsSomaliaSouth AfricaSouth AsiaSouth Asia (IDA & IBRD)South SudanSpainSri LankaSt. Kitts and NevisSt. LuciaSt. Vincent and the GrenadinesSub-Saharan Africa Sub-Saharan Africa (excluding high income)Sub-Saharan Africa (IDA & IBRD countries)SudanSurinameSwazilandSwedenSwitzerlandSyrian Arab RepublicTajikistanTanzaniaThailandTimor-LesteTogoTongaTrinidad and TobagoTunisiaTurkeyTurkmenistanTurks and Caicos IslandsTuvaluUgandaUkraineUnited Arab EmiratesUnited KingdomUnited StatesUpper middle incomeUruguayUzbekistanVanuatuVenezuela, RBVietnamVirgin Islands (U.S.)West Bank and GazaWorldYemen, Rep.ZambiaZimbabwe Timeline:
This timeline shows a graph from 1991 to 2016 of South Asia (IDA & IBRD). No data until 1990. Number of actual observations by date: 26.
Source name:
World Development Indicators
Source organization:
WHO/UNICEF Joint Monitoring Programme (JMP) for Water Supply and Sanitation (http://www.wssinfo.org/).
Categories, topics:
Health, Urban Development
Last updated:
apr 23, 2017
Indicators value changes by year
Minimum:
51.218
jan 1, 1992
Maximum:
64.601
jan 1, 2016
At the date of observation
Value
Absolute change
Change from previous value
jan 1, 1991
51.389
+51.389
0.0%
jan 1, 1992
51.218
-0.171
-0.33%
jan 1, 1993
51.717
+0.5
0.98%
jan 1, 1994
52.207
+0.49
0.95%
jan 1, 1995
52.797
+0.59
1.13%
jan 1, 1996
53.306
+0.508
0.96%
jan 1, 1997
53.892
+0.586
1.1%
jan 1, 1998
54.502
+0.61
1.13%
jan 1, 1999
55.104
+0.603
1.11%
jan 1, 2000
55.618
+0.514
0.93%
jan 1, 2001
56.228
+0.61
1.1%
jan 1, 2002
56.825
+0.597
1.06%
jan 1, 2003
57.412
+0.587
1.03%
jan 1, 2004
57.928
+0.516
0.9%
jan 1, 2005
58.521
+0.593
1.02%
jan 1, 2006
59.116
+0.595
1.02%
jan 1, 2007
59.718
+0.602
1.02%
jan 1, 2008
60.256
+0.538
0.9%
jan 1, 2009
60.852
+0.596
0.99%
jan 1, 2010
61.462
+0.61
1.0%
jan 1, 2011
62.081
+0.619
1.01%
jan 1, 2012
62.605
+0.524
0.84%
jan 1, 2013
63.226
+0.621
0.99%
jan 1, 2014
63.839
+0.613
0.97%
jan 1, 2015
64.44
+0.601
0.94%
jan 1, 2016
64.601
+0.161
0.25%
Ranking of countries by current statistics by years


Comments: