29
/
en
AIzaSyAYiBZKx7MnpbEhh9jyipgxe19OcubqV5w
April 1, 2024
56487
Small states
SST
false
2
1
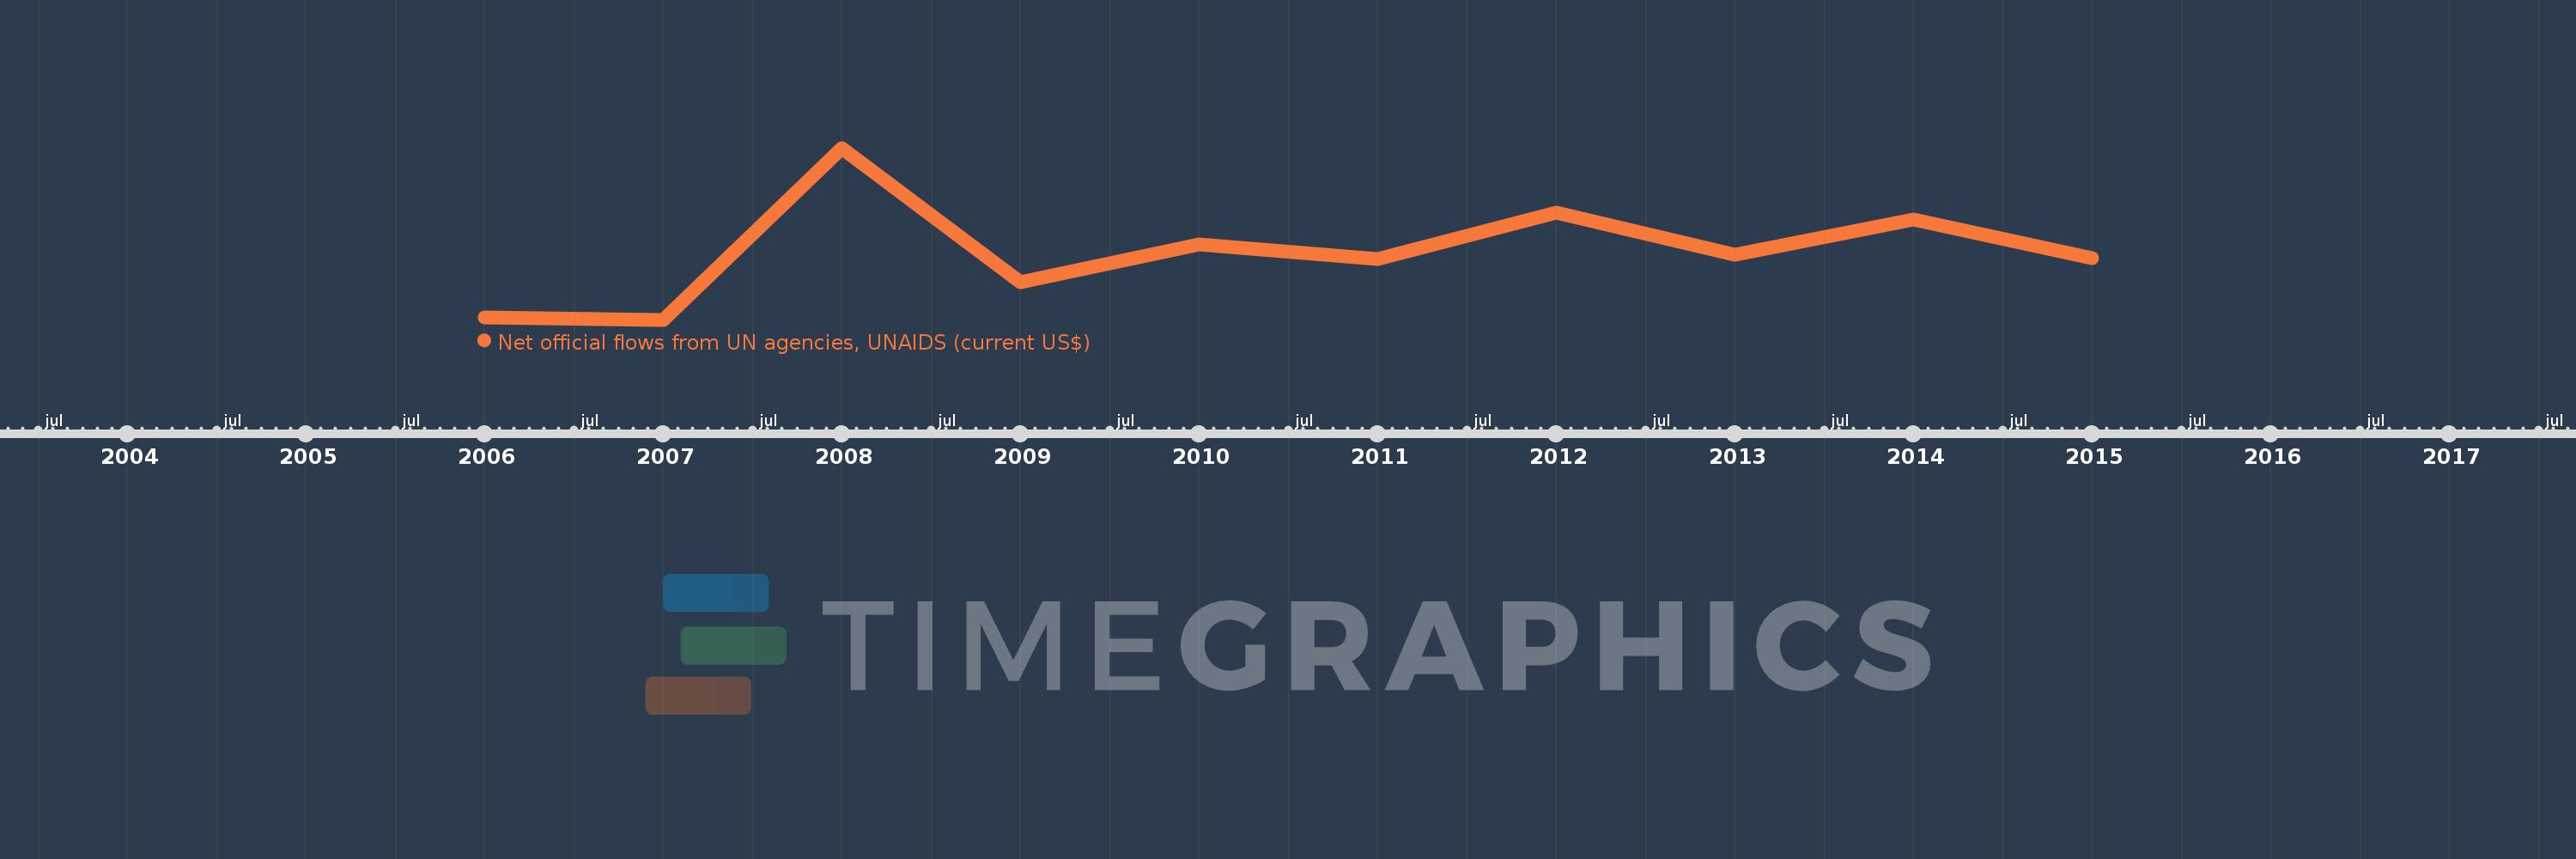
Net official flows from UN agencies, UNAIDS (current US$)
2015,2014,2013,2012,2011,2010,2009,2008,2007,2006
This statistics in other country:
Timeline:
This timeline shows a graph from 2006 to 2015 of Small states. No data until 2005. Number of actual observations by date: 10.
Source name:
World Development Indicators
Source organization:
Development Assistance Committee of the Organisation for Economic Co-operation and Development, Geographical Distribution of Financial Flows to Developing Countries, Development Co-operation Report, and International Development Statistics database. Data are available online at: www.oecd.org/dac/stats/idsonline.
Categories, topics:
Aid Effectiveness
Last updated:
apr 23, 2017
Indicators value changes by year
Minimum:
3.44 mln
jan 1, 2007
Maximum:
10.32 mln
jan 1, 2008
At the date of observation
Value
Absolute change
Change from previous value
jan 1, 2006
3.52 mln
+3.52 mln
0.0%
jan 1, 2007
3.44 mln
-80.0K
-2.27%
jan 1, 2008
10.32 mln
+6.88 mln
200.0%
jan 1, 2009
4.96 mln
-5.36 mln
-51.94%
jan 1, 2010
6.44 mln
+1.48 mln
29.84%
jan 1, 2011
5.88 mln
-560.0K
-8.7%
jan 1, 2012
7.74 mln
+1.86 mln
31.63%
jan 1, 2013
6.05 mln
-1.69 mln
-21.83%
jan 1, 2014
7.47 mln
+1.42 mln
23.47%
jan 1, 2015
5.92 mln
-1.55 mln
-20.75%
Ranking of countries by current statistics by years


Comments: