29
/
en
AIzaSyAYiBZKx7MnpbEhh9jyipgxe19OcubqV5w
April 1, 2024
55823
Pre-demographic dividend
PRE
false
2
1
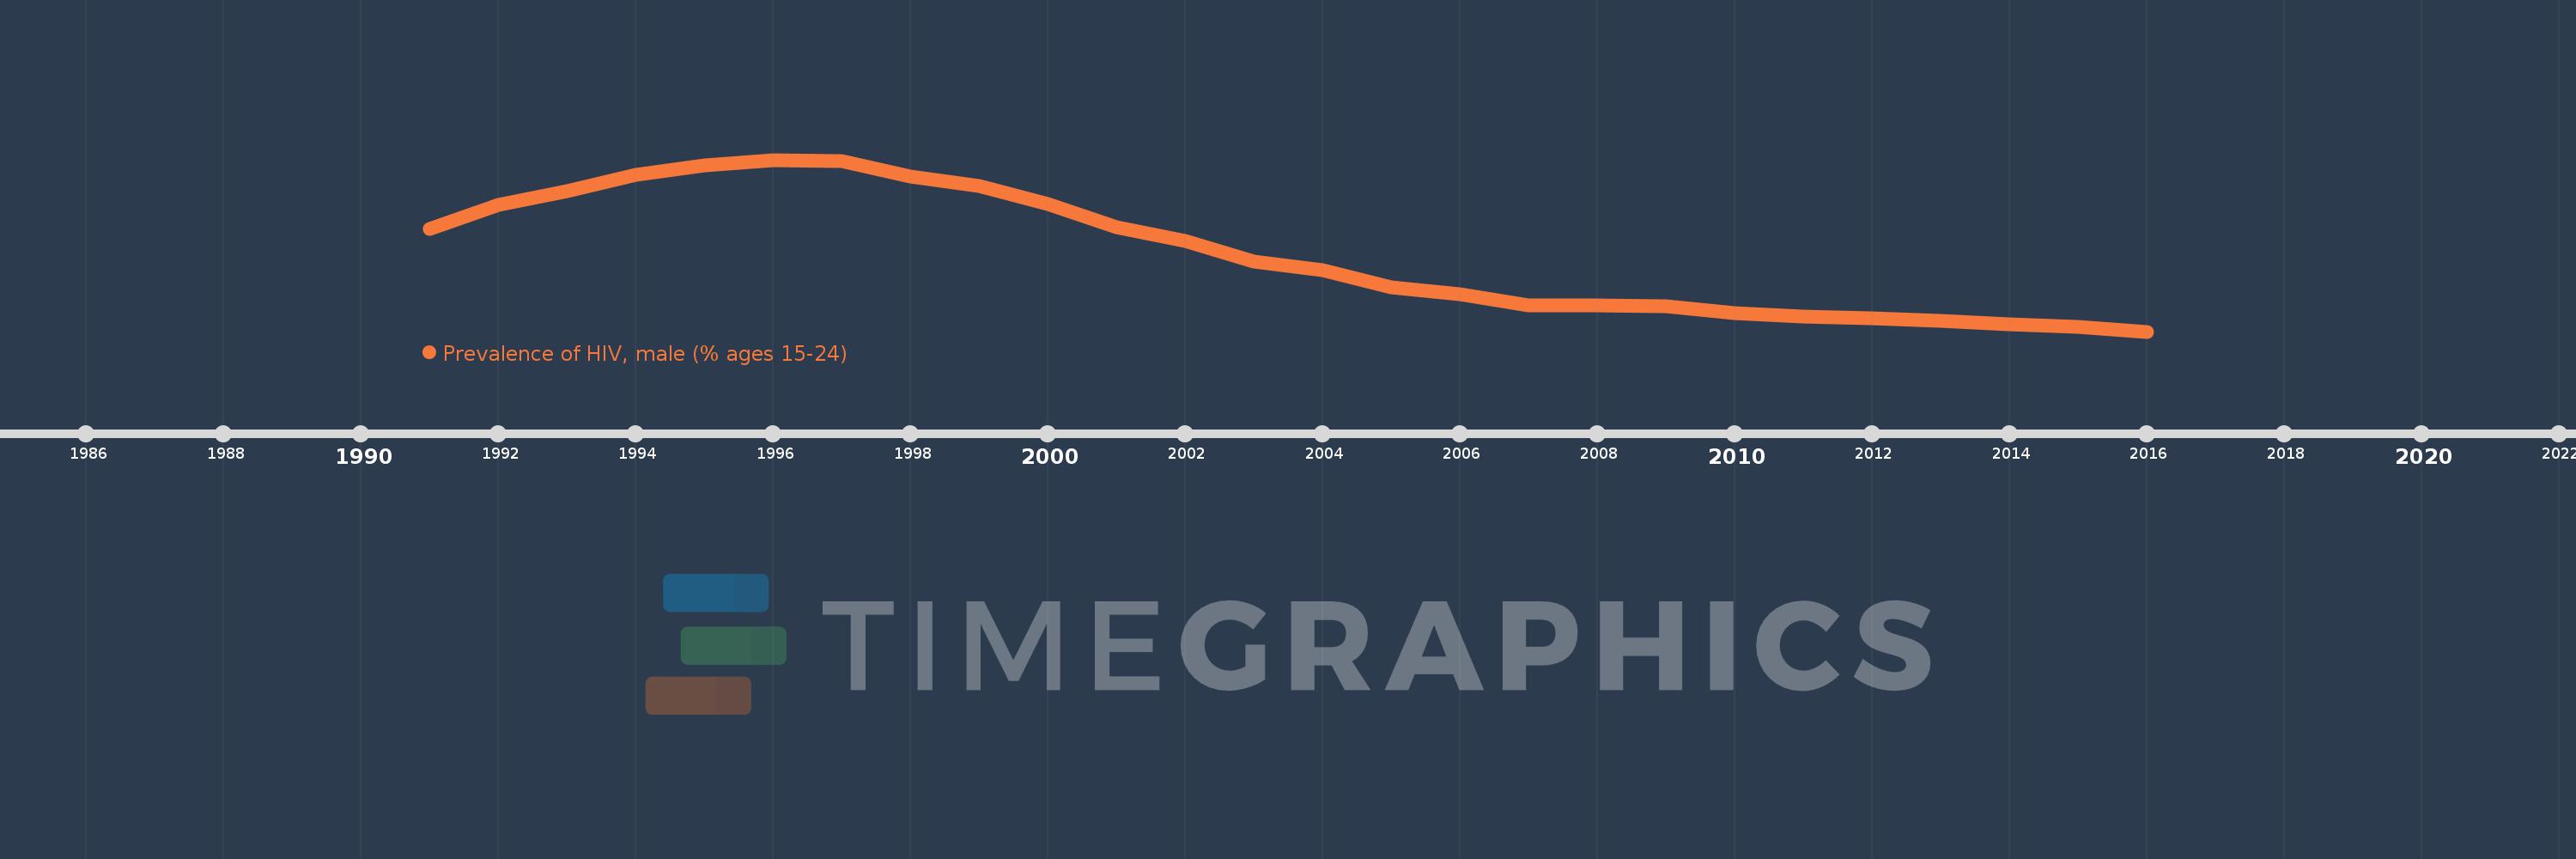
Prevalence of HIV, male (% ages 15-24)
2016,2015,2014,2013,2012,2011,2010,2009,2008,2007,2006,2005,2004,2003,2002,2001,2000,1999,1998,1997,1996,1995,1994,1993,1992,1991
This statistics in other country:
Timeline:
This timeline shows a graph from 1991 to 2016 of Pre-demographic dividend. No data until 1990. Number of actual observations by date: 26.
Source name:
World Development Indicators
Source organization:
UNAIDS estimates.
Categories, topics:
Health, Gender, Social Development
Last updated:
apr 23, 2017
Indicators value changes by year
At the date of observation
Value
Absolute change
Change from previous value
jan 1, 1991
1.202
+1.202
0.0%
jan 1, 1992
1.298
+0.096
7.96%
jan 1, 1993
1.352
+0.054
4.15%
jan 1, 1994
1.417
+0.066
4.85%
jan 1, 1995
1.455
+0.037
2.61%
jan 1, 1996
1.476
+0.021
1.45%
jan 1, 1997
1.472
-0.003
-0.22%
jan 1, 1998
1.409
-0.063
-4.31%
jan 1, 1999
1.371
-0.038
-2.71%
jan 1, 2000
1.301
-0.07
-5.12%
jan 1, 2001
1.21
-0.091
-7.01%
jan 1, 2002
1.157
-0.052
-4.31%
jan 1, 2003
1.075
-0.082
-7.11%
jan 1, 2004
1.041
-0.034
-3.13%
jan 1, 2005
0.972
-0.069
-6.62%
jan 1, 2006
0.945
-0.028
-2.86%
jan 1, 2007
0.903
-0.042
-4.44%
jan 1, 2008
0.9
-0.003
-0.33%
jan 1, 2009
0.897
-0.003
-0.34%
jan 1, 2010
0.871
-0.026
-2.86%
jan 1, 2011
0.858
-0.013
-1.51%
jan 1, 2012
0.849
-0.009
-1.07%
jan 1, 2013
0.839
-0.009
-1.1%
jan 1, 2014
0.828
-0.012
-1.41%
jan 1, 2015
0.818
-0.01
-1.19%
jan 1, 2016
0.798
-0.02
-2.45%
Ranking of countries by current statistics by years


Comments: