29
/
en
AIzaSyAYiBZKx7MnpbEhh9jyipgxe19OcubqV5w
April 1, 2024
54522
Post-demographic dividend
PST
false
2
1
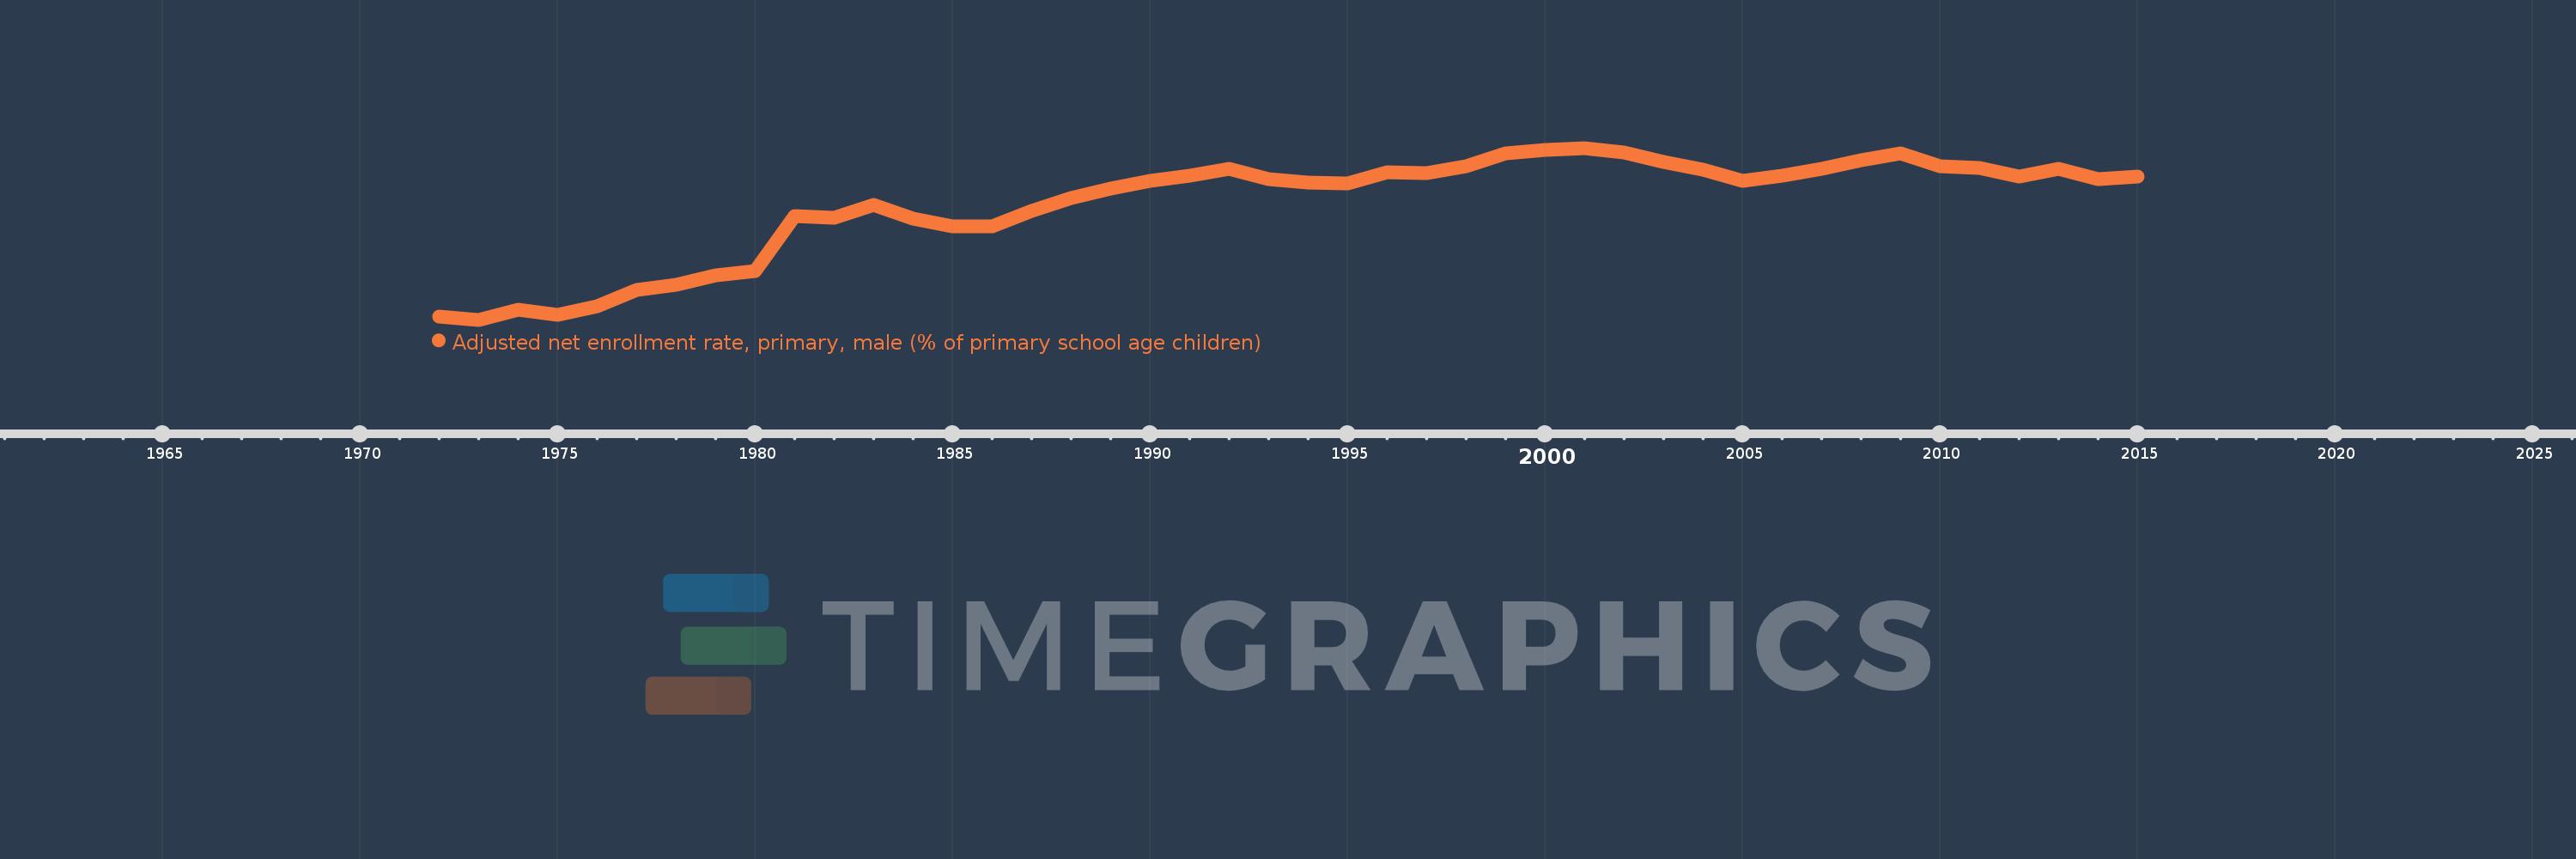
Adjusted net enrollment rate, primary, male (% of primary school age children)
2015,2014,2013,2012,2011,2010,2009,2008,2007,2006,2005,2004,2003,2002,2001,2000,1999,1998,1997,1996,1995,1994,1993,1992,1991,1990,1989,1988,1987,1986,1985,1984,1983,1982,1981,1980,1979,1978,1977,1976,1975,1974,1973,1972
This statistics in other country:
AfghanistanAlbaniaAlgeriaAngolaAntigua and BarbudaArab WorldArgentinaArmeniaArubaAustraliaAustriaAzerbaijanBahamas, TheBahrainBangladeshBarbadosBelarusBelgiumBelizeBeninBermudaBhutanBoliviaBosnia and HerzegovinaBotswanaBrazilBrunei DarussalamBulgariaBurkina FasoBurundiCabo VerdeCambodiaCameroonCanadaCaribbean small statesCentral African RepublicCentral Europe and the BalticsChadChileChinaColombiaComorosCongo, Dem. Rep.Congo, Rep.Costa RicaCote d'IvoireCroatiaCubaCyprusDenmarkDjiboutiDominicaDominican RepublicEarly-demographic dividendEast Asia & PacificEast Asia & Pacific (excluding high income)East Asia & Pacific (IDA & IBRD countries)EcuadorEgypt, Arab Rep.El SalvadorEquatorial GuineaEritreaEstoniaEthiopiaEuro areaEurope & Central AsiaEurope & Central Asia (excluding high income)Europe & Central Asia (IDA & IBRD countries)European UnionFijiFinlandFragile and conflict affected situationsFranceGabonGambia, TheGeorgiaGhanaGreeceGrenadaGuatemalaGuineaGuinea-BissauGuyanaHaitiHeavily indebted poor countries (HIPC)High incomeHondurasHong Kong SAR, ChinaHungaryIBRD onlyIcelandIDA & IBRD totalIDA blendIDA onlyIDA totalIndiaIndonesiaIran, Islamic Rep.IraqIrelandIsraelItalyJamaicaJapanJordanKazakhstanKenyaKiribatiKorea, Dem. People’s Rep.Korea, Rep.KuwaitKyrgyz RepublicLao PDRLate-demographic dividendLatin America & Caribbean Latin America & Caribbean (excluding high income)Latin America & the Caribbean (IDA & IBRD countries)LatviaLeast developed countries: UN classificationLebanonLesothoLiberiaLibyaLiechtensteinLithuaniaLow & middle incomeLow incomeLower middle incomeLuxembourgMacao SAR, ChinaMacedonia, FYRMadagascarMalawiMaldivesMaliMaltaMarshall IslandsMauritaniaMauritiusMexicoMicronesia, Fed. Sts.Middle East & North AfricaMiddle East & North Africa (excluding high income)Middle East & North Africa (IDA & IBRD countries)Middle incomeMoldovaMongoliaMontenegroMoroccoMozambiqueMyanmarNamibiaNauruNepalNetherlandsNew ZealandNicaraguaNigerNigeriaNorth AmericaNorwayOECD membersOmanOther small statesPacific island small statesPakistanPanamaPapua New GuineaParaguayPeruPhilippinesPolandPortugalPost-demographic dividendPre-demographic dividendPuerto RicoQatarRomaniaRussian FederationRwandaSamoaSan MarinoSao Tome and PrincipeSaudi ArabiaSenegalSerbiaSeychellesSierra LeoneSloveniaSmall statesSolomon IslandsSomaliaSouth AfricaSouth AsiaSouth Asia (IDA & IBRD)South SudanSpainSri LankaSt. Kitts and NevisSt. LuciaSt. Vincent and the GrenadinesSub-Saharan Africa Sub-Saharan Africa (excluding high income)Sub-Saharan Africa (IDA & IBRD countries)SudanSurinameSwazilandSwedenSwitzerlandSyrian Arab RepublicTajikistanTanzaniaThailandTimor-LesteTogoTongaTrinidad and TobagoTunisiaTurkeyTuvaluUgandaUkraineUnited Arab EmiratesUnited KingdomUnited StatesUpper middle incomeUruguayUzbekistanVanuatuVenezuela, RBWest Bank and GazaWorldYemen, Rep.ZambiaZimbabwe Timeline:
This timeline shows a graph from 1972 to 2015 of Post-demographic dividend. No data until 1971. Number of actual observations by date: 44.
Source name:
World Development Indicators
Source organization:
United Nations Educational, Scientific, and Cultural Organization (UNESCO) Institute for Statistics.
Categories, topics:
Education, Gender
Last updated:
apr 23, 2017
Indicators value changes by year
Minimum:
89.574
jan 1, 1973
Maximum:
98.215
jan 1, 2001
At the date of observation
Value
Absolute change
Change from previous value
jan 1, 1972
89.717
+89.717
0.0%
jan 1, 1973
89.574
-0.143
-0.16%
jan 1, 1974
90.073
+0.499
0.56%
jan 1, 1975
89.809
-0.263
-0.29%
jan 1, 1976
90.252
+0.443
0.49%
jan 1, 1977
91.067
+0.816
0.9%
jan 1, 1978
91.327
+0.259
0.28%
jan 1, 1979
91.811
+0.484
0.53%
jan 1, 1980
92.03
+0.219
0.24%
jan 1, 1981
94.768
+2.738
2.98%
jan 1, 1982
94.705
-0.063
-0.07%
jan 1, 1983
95.342
+0.637
0.67%
jan 1, 1984
94.679
-0.662
-0.69%
jan 1, 1985
94.258
-0.421
-0.44%
jan 1, 1986
94.258
+0.0
0.0%
jan 1, 1987
95.042
+0.784
0.83%
jan 1, 1988
95.683
+0.641
0.67%
jan 1, 1989
96.18
+0.497
0.52%
jan 1, 1990
96.544
+0.364
0.38%
jan 1, 1991
96.84
+0.296
0.31%
jan 1, 1992
97.174
+0.334
0.34%
jan 1, 1993
96.649
-0.525
-0.54%
jan 1, 1994
96.455
-0.194
-0.2%
jan 1, 1995
96.437
-0.018
-0.02%
jan 1, 1996
96.991
+0.553
0.57%
jan 1, 1997
96.96
-0.03
-0.03%
jan 1, 1998
97.315
+0.355
0.37%
jan 1, 1999
97.923
+0.608
0.62%
jan 1, 2000
98.121
+0.198
0.2%
jan 1, 2001
98.215
+0.094
0.1%
jan 1, 2002
98.005
-0.21
-0.21%
jan 1, 2003
97.53
-0.475
-0.48%
jan 1, 2004
97.141
-0.389
-0.4%
jan 1, 2005
96.555
-0.585
-0.6%
jan 1, 2006
96.84
+0.285
0.3%
jan 1, 2007
97.149
+0.309
0.32%
jan 1, 2008
97.617
+0.468
0.48%
jan 1, 2009
97.946
+0.329
0.34%
jan 1, 2010
97.279
-0.667
-0.68%
jan 1, 2011
97.202
-0.077
-0.08%
jan 1, 2012
96.787
-0.414
-0.43%
jan 1, 2013
97.175
+0.387
0.4%
jan 1, 2014
96.628
-0.547
-0.56%
jan 1, 2015
96.765
+0.137
0.14%
Ranking of countries by current statistics by years


Comments: