29
/
en
AIzaSyAYiBZKx7MnpbEhh9jyipgxe19OcubqV5w
April 1, 2024
54124
Pacific island small states
PSS
false
2
1
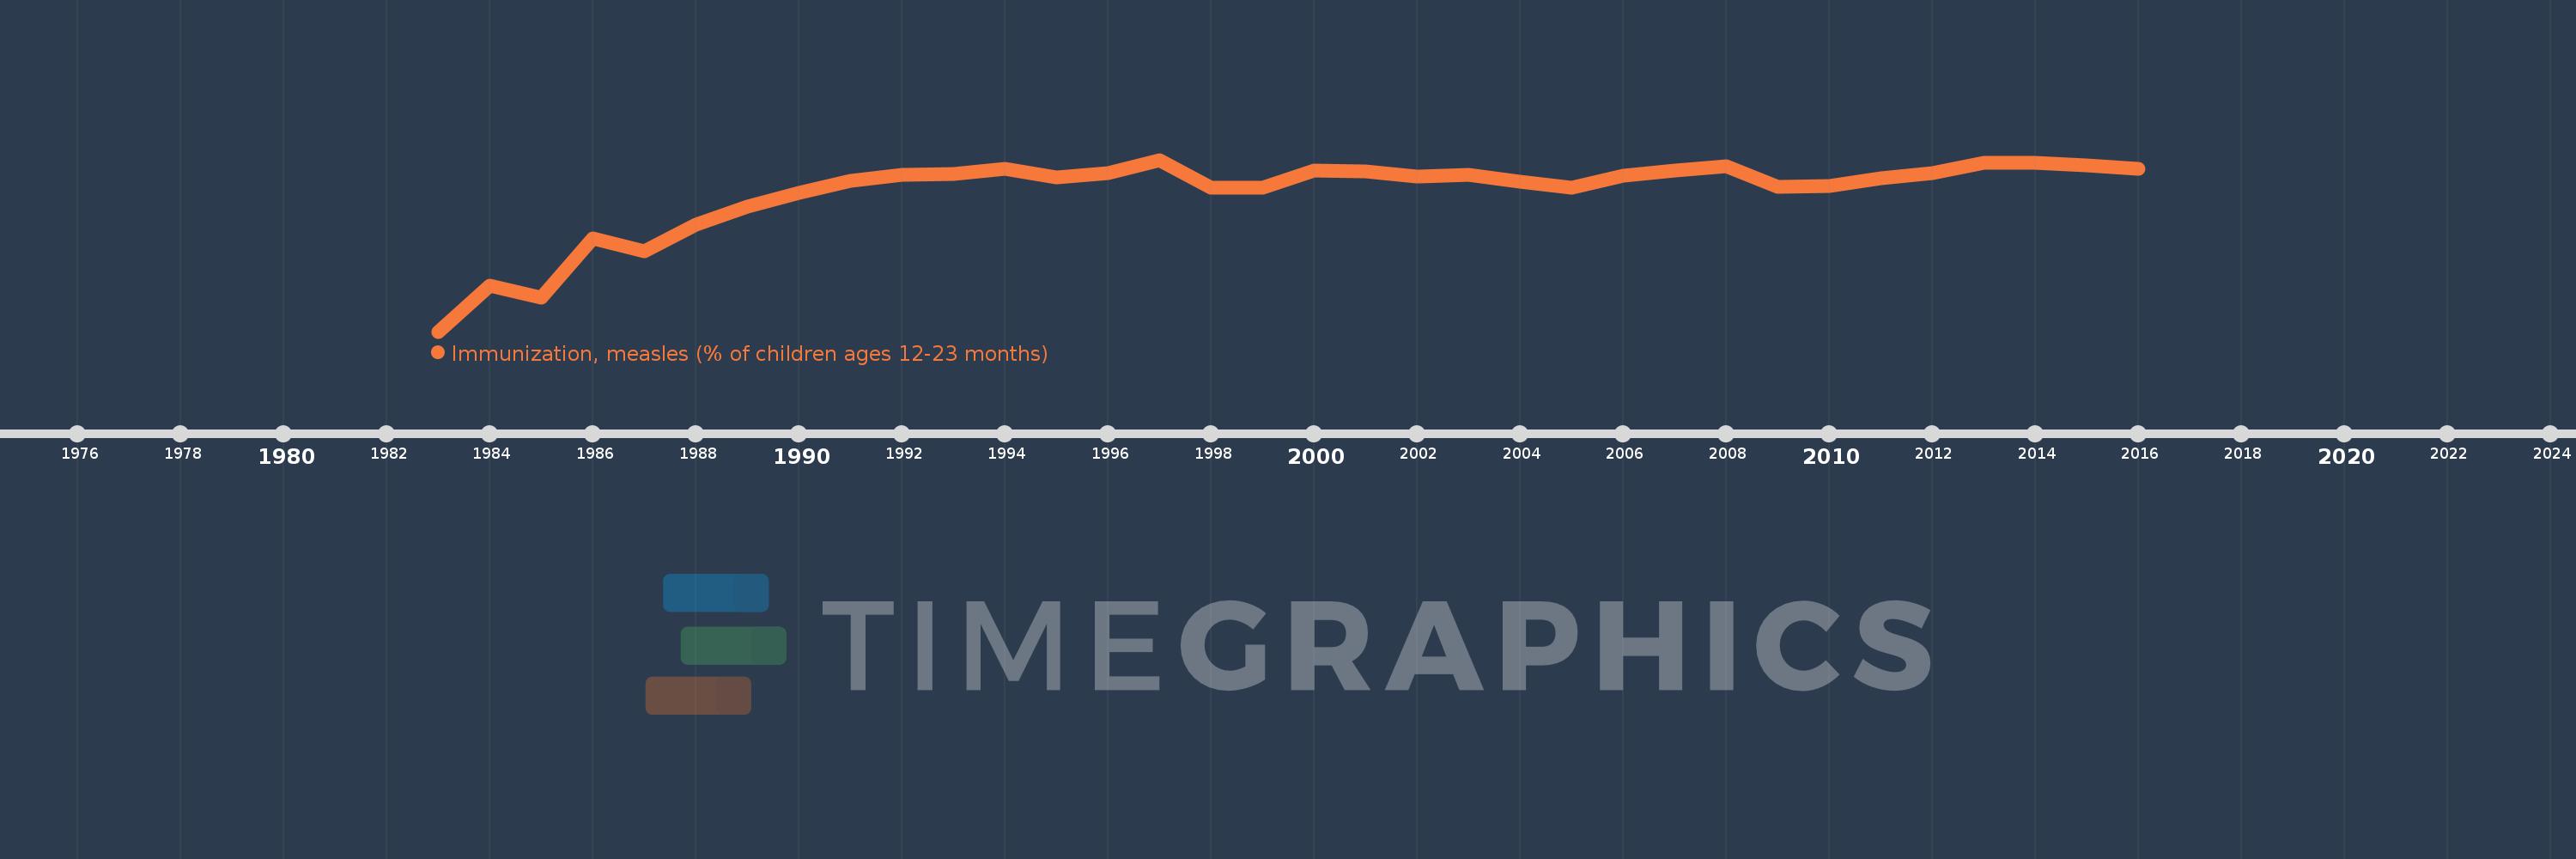
Immunization, measles (% of children ages 12-23 months)
2016,2015,2014,2013,2012,2011,2010,2009,2008,2007,2006,2005,2004,2003,2002,2001,2000,1999,1998,1997,1996,1995,1994,1993,1992,1991,1990,1989,1988,1987,1986,1985,1984,1983
This statistics in other country:
AfghanistanAlbaniaAlgeriaAndorraAngolaAntigua and BarbudaArab WorldArgentinaArmeniaAustraliaAustriaAzerbaijanBahamas, TheBahrainBangladeshBarbadosBelarusBelgiumBelizeBeninBhutanBoliviaBosnia and HerzegovinaBotswanaBrazilBrunei DarussalamBulgariaBurkina FasoBurundiCabo VerdeCambodiaCameroonCanadaCaribbean small statesCentral African RepublicCentral Europe and the BalticsChadChileChinaColombiaComorosCongo, Dem. Rep.Congo, Rep.Costa RicaCote d'IvoireCroatiaCubaCyprusCzech RepublicDenmarkDjiboutiDominicaDominican RepublicEarly-demographic dividendEast Asia & PacificEast Asia & Pacific (excluding high income)East Asia & Pacific (IDA & IBRD countries)EcuadorEgypt, Arab Rep.El SalvadorEquatorial GuineaEritreaEstoniaEthiopiaEuro areaEurope & Central AsiaEurope & Central Asia (excluding high income)Europe & Central Asia (IDA & IBRD countries)European UnionFijiFinlandFragile and conflict affected situationsFranceGabonGambia, TheGeorgiaGermanyGhanaGreeceGrenadaGuatemalaGuineaGuinea-BissauGuyanaHaitiHeavily indebted poor countries (HIPC)High incomeHondurasHungaryIBRD onlyIcelandIDA & IBRD totalIDA blendIDA onlyIDA totalIndiaIndonesiaIran, Islamic Rep.IraqIrelandIsraelItalyJamaicaJapanJordanKazakhstanKenyaKiribatiKorea, Dem. People’s Rep.Korea, Rep.KuwaitKyrgyz RepublicLao PDRLate-demographic dividendLatin America & Caribbean Latin America & Caribbean (excluding high income)Latin America & the Caribbean (IDA & IBRD countries)LatviaLeast developed countries: UN classificationLebanonLesothoLiberiaLibyaLithuaniaLow & middle incomeLow incomeLower middle incomeLuxembourgMacedonia, FYRMadagascarMalawiMalaysiaMaldivesMaliMaltaMarshall IslandsMauritaniaMauritiusMexicoMicronesia, Fed. Sts.Middle East & North AfricaMiddle East & North Africa (excluding high income)Middle East & North Africa (IDA & IBRD countries)Middle incomeMoldovaMonacoMongoliaMontenegroMoroccoMozambiqueMyanmarNamibiaNauruNepalNetherlandsNew ZealandNicaraguaNigerNigeriaNorth AmericaNorwayOECD membersOmanOther small statesPacific island small statesPakistanPalauPanamaPapua New GuineaParaguayPeruPhilippinesPolandPortugalPost-demographic dividendPre-demographic dividendQatarRomaniaRussian FederationRwandaSamoaSan MarinoSao Tome and PrincipeSaudi ArabiaSenegalSerbiaSeychellesSierra LeoneSingaporeSlovak RepublicSloveniaSmall statesSolomon IslandsSomaliaSouth AfricaSouth AsiaSouth Asia (IDA & IBRD)South SudanSpainSri LankaSt. Kitts and NevisSt. LuciaSt. Vincent and the GrenadinesSub-Saharan Africa Sub-Saharan Africa (excluding high income)Sub-Saharan Africa (IDA & IBRD countries)SudanSurinameSwazilandSwedenSwitzerlandSyrian Arab RepublicTajikistanTanzaniaThailandTimor-LesteTogoTongaTrinidad and TobagoTunisiaTurkeyTurkmenistanTuvaluUgandaUkraineUnited Arab EmiratesUnited KingdomUnited StatesUpper middle incomeUruguayUzbekistanVanuatuVenezuela, RBVietnamWorldYemen, Rep.ZambiaZimbabwe Timeline:
This timeline shows a graph from 1983 to 2016 of Pacific island small states. No data until 1982. Number of actual observations by date: 34.
Source name:
World Development Indicators
Source organization:
WHO and UNICEF (http://www.who.int/immunization/monitoring_surveillance/en/).
Categories, topics:
Health
Last updated:
apr 23, 2017
Indicators value changes by year
Minimum:
16.575
jan 1, 1983
Maximum:
87.774
jan 1, 1997
At the date of observation
Value
Absolute change
Change from previous value
jan 1, 1983
16.575
+16.575
0.0%
jan 1, 1984
35.506
+18.931
114.21%
jan 1, 1985
30.686
-4.82
-13.58%
jan 1, 1986
55.3
+24.614
80.21%
jan 1, 1987
49.693
-5.607
-10.14%
jan 1, 1988
60.728
+11.035
22.21%
jan 1, 1989
68.304
+7.576
12.47%
jan 1, 1990
73.964
+5.66
8.29%
jan 1, 1991
79.012
+5.048
6.83%
jan 1, 1992
81.641
+2.629
3.33%
jan 1, 1993
81.782
+0.141
0.17%
jan 1, 1994
84.066
+2.284
2.79%
jan 1, 1995
80.349
-3.717
-4.42%
jan 1, 1996
82.1
+1.751
2.18%
jan 1, 1997
87.774
+5.674
6.91%
jan 1, 1998
76.046
-11.728
-13.36%
jan 1, 1999
76.254
+0.208
0.27%
jan 1, 2000
83.218
+6.964
9.13%
jan 1, 2001
83.048
-0.169
-0.2%
jan 1, 2002
80.841
-2.208
-2.66%
jan 1, 2003
81.39
+0.549
0.68%
jan 1, 2004
78.779
-2.611
-3.21%
jan 1, 2005
76.09
-2.689
-3.41%
jan 1, 2006
81.216
+5.126
6.74%
jan 1, 2007
83.414
+2.198
2.71%
jan 1, 2008
85.085
+1.671
2.0%
jan 1, 2009
76.412
-8.673
-10.19%
jan 1, 2010
76.832
+0.42
0.55%
jan 1, 2011
80.212
+3.38
4.4%
jan 1, 2012
82.347
+2.136
2.66%
jan 1, 2013
86.634
+4.287
5.21%
jan 1, 2014
86.425
-0.209
-0.24%
jan 1, 2015
85.564
-0.861
-1.0%
jan 1, 2016
83.887
-1.677
-1.96%
Ranking of countries by current statistics by years


Comments: