29
/
en
AIzaSyAYiBZKx7MnpbEhh9jyipgxe19OcubqV5w
April 1, 2024
53732
Other small states
OSS
false
2
1
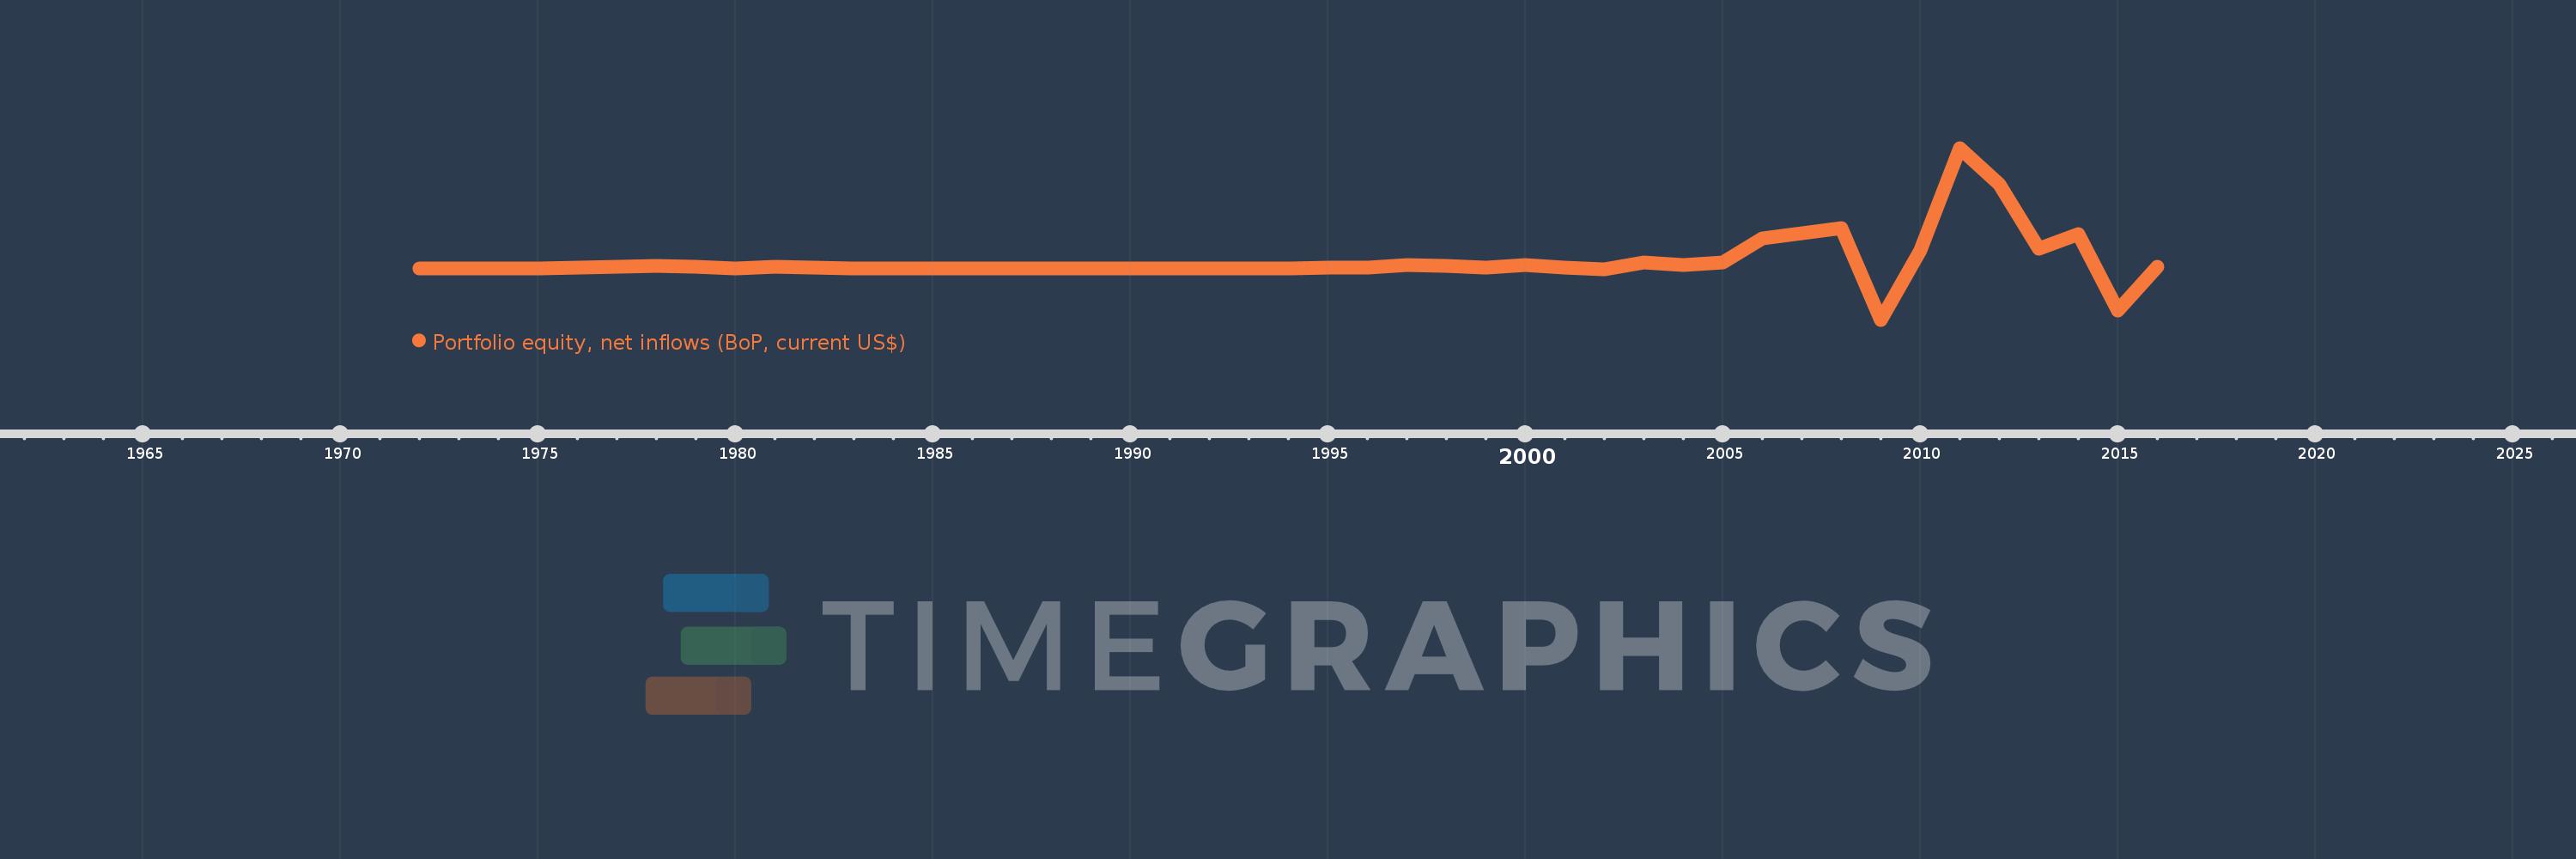
Portfolio equity, net inflows (BoP, current US$)
2016,2015,2014,2013,2012,2011,2010,2009,2008,2007,2006,2005,2004,2003,2002,2001,2000,1999,1998,1997,1996,1995,1994,1993,1992,1991,1990,1989,1988,1987,1986,1985,1984,1983,1982,1981,1980,1979,1978,1977,1976,1975,1974,1973,1972
This statistics in other country:
AfghanistanAlbaniaAlgeriaAngolaAntigua and BarbudaArab WorldArgentinaArmeniaArubaAustraliaAustriaAzerbaijanBahamas, TheBahrainBangladeshBarbadosBelarusBelgiumBelizeBeninBermudaBhutanBoliviaBosnia and HerzegovinaBotswanaBrazilBulgariaBurkina FasoBurundiCabo VerdeCambodiaCameroonCanadaCaribbean small statesCentral African RepublicCentral Europe and the BalticsChadChileChinaColombiaComorosCongo, Dem. Rep.Congo, Rep.Costa RicaCote d'IvoireCroatiaCuracaoCyprusCzech RepublicDenmarkDjiboutiDominicaDominican RepublicEarly-demographic dividendEast Asia & PacificEast Asia & Pacific (excluding high income)East Asia & Pacific (IDA & IBRD countries)EcuadorEgypt, Arab Rep.El SalvadorEquatorial GuineaEstoniaEthiopiaEuro areaEurope & Central AsiaEurope & Central Asia (excluding high income)Europe & Central Asia (IDA & IBRD countries)European UnionFijiFinlandFragile and conflict affected situationsFranceFrench PolynesiaGabonGambia, TheGeorgiaGermanyGhanaGreeceGrenadaGuatemalaGuineaGuinea-BissauGuyanaHaitiHeavily indebted poor countries (HIPC)High incomeHondurasHong Kong SAR, ChinaHungaryIBRD onlyIcelandIDA & IBRD totalIDA blendIDA onlyIDA totalIndiaIndonesiaIran, Islamic Rep.IraqIrelandIsraelItalyJamaicaJapanJordanKazakhstanKenyaKiribatiKorea, Rep.KosovoKuwaitKyrgyz RepublicLao PDRLate-demographic dividendLatin America & Caribbean Latin America & Caribbean (excluding high income)Latin America & the Caribbean (IDA & IBRD countries)LatviaLeast developed countries: UN classificationLebanonLesothoLiberiaLibyaLithuaniaLow & middle incomeLow incomeLower middle incomeLuxembourgMacao SAR, ChinaMacedonia, FYRMadagascarMalawiMalaysiaMaldivesMaliMaltaMarshall IslandsMauritaniaMauritiusMexicoMiddle East & North AfricaMiddle East & North Africa (excluding high income)Middle East & North Africa (IDA & IBRD countries)Middle incomeMoldovaMongoliaMontenegroMoroccoMozambiqueMyanmarNamibiaNepalNetherlandsNew CaledoniaNew ZealandNicaraguaNigerNigeriaNorth AmericaNorwayOECD membersOmanOther small statesPacific island small statesPakistanPanamaPapua New GuineaParaguayPeruPhilippinesPolandPortugalPost-demographic dividendPre-demographic dividendQatarRomaniaRussian FederationRwandaSamoaSao Tome and PrincipeSaudi ArabiaSenegalSerbiaSeychellesSierra LeoneSingaporeSlovak RepublicSloveniaSmall statesSolomon IslandsSomaliaSouth AfricaSouth AsiaSouth Asia (IDA & IBRD)SpainSri LankaSt. Kitts and NevisSt. LuciaSt. Vincent and the GrenadinesSub-Saharan Africa Sub-Saharan Africa (excluding high income)Sub-Saharan Africa (IDA & IBRD countries)SudanSurinameSwazilandSwedenSwitzerlandSyrian Arab RepublicTajikistanTanzaniaThailandTimor-LesteTogoTongaTrinidad and TobagoTunisiaTurkeyUgandaUkraineUnited KingdomUnited StatesUpper middle incomeUruguayVanuatuVenezuela, RBVietnamWest Bank and GazaWorldYemen, Rep.ZambiaZimbabwe Timeline:
This timeline shows a graph from 1972 to 2016 of Other small states. No data until 1971. Number of actual observations by date: 45.
Source name:
World Development Indicators
Source organization:
International Monetary Fund, Balance of Payments database, and World Bank, International Debt Statistics.
Categories, topics:
Economy & Growth, Financial Sector, External Debt
Last updated:
apr 23, 2017
Indicators value changes by year
Minimum:
-4.108 bln
jan 1, 2009
Maximum:
9.692 bln
jan 1, 2011
At the date of observation
Value
Absolute change
Change from previous value
jan 1, 1976
96.081 mln
+96.081 mln
%
jan 1, 1977
139.03 mln
+42.949 mln
44.7%
jan 1, 1978
195.122 mln
+56.092 mln
40.35%
jan 1, 1979
116.24 mln
-78.882 mln
-40.43%
jan 1, 1980
42.189 mln
-74.051 mln
-63.71%
jan 1, 1981
121.485 mln
+79.296 mln
187.96%
jan 1, 1982
69.947 mln
-51.539 mln
-42.42%
jan 1, 1983
-184.193K
-70.131 mln
-100.26%
jan 1, 1984
359.034K
+543.227K
-294.92%
jan 1, 1985
-135.568K
-494.602K
-137.76%
jan 1, 1986
2.024 mln
+2.16 mln
-1.59K%
jan 1, 1987
-393.868K
-2.418 mln
-119.46%
jan 1, 1988
2.358 mln
+2.751 mln
-698.56%
jan 1, 1989
6.29 mln
+3.932 mln
166.8%
jan 1, 1990
7.397 mln
+1.107 mln
17.6%
jan 1, 1991
-2.203 mln
-9.6 mln
-129.78%
jan 1, 1992
-4.201 mln
-1.998 mln
90.69%
jan 1, 1993
5.961 mln
+10.162 mln
-241.89%
jan 1, 1994
206.662K
-5.754 mln
-96.53%
jan 1, 1995
48.129 mln
+47.922 mln
23.19K%
jan 1, 1996
79.932 mln
+31.802 mln
66.08%
jan 1, 1997
292.888 mln
+212.956 mln
266.42%
jan 1, 1998
197.549 mln
-95.339 mln
-32.55%
jan 1, 1999
94.52 mln
-103.029 mln
-52.15%
jan 1, 2000
280.02 mln
+185.5 mln
196.25%
jan 1, 2001
51.553 mln
-228.467 mln
-81.59%
jan 1, 2002
-27.073 mln
-78.625 mln
-152.51%
jan 1, 2003
496.319 mln
+523.392 mln
-1.93K%
jan 1, 2004
312.248 mln
-184.071 mln
-37.09%
jan 1, 2005
517.782 mln
+205.534 mln
65.82%
jan 1, 2006
2.449 bln
+1.931 bln
372.94%
jan 1, 2007
2.813 bln
+364.419 mln
14.88%
jan 1, 2008
3.276 bln
+462.889 mln
16.45%
jan 1, 2009
-4.108 bln
-7.384 bln
-225.39%
jan 1, 2010
1.455 bln
+5.563 bln
-135.43%
jan 1, 2011
9.692 bln
+8.237 bln
565.96%
jan 1, 2012
6.759 bln
-2.933 bln
-30.26%
jan 1, 2013
1.601 bln
-5.158 bln
-76.32%
jan 1, 2014
2.743 bln
+1.143 bln
71.4%
jan 1, 2015
-3.36 bln
-6.104 bln
-222.48%
jan 1, 2016
149.286 mln
+3.509 bln
-104.44%
Ranking of countries by current statistics by years


Comments: