29
/
en
AIzaSyAYiBZKx7MnpbEhh9jyipgxe19OcubqV5w
April 1, 2024
53586
Other small states
OSS
false
2
1
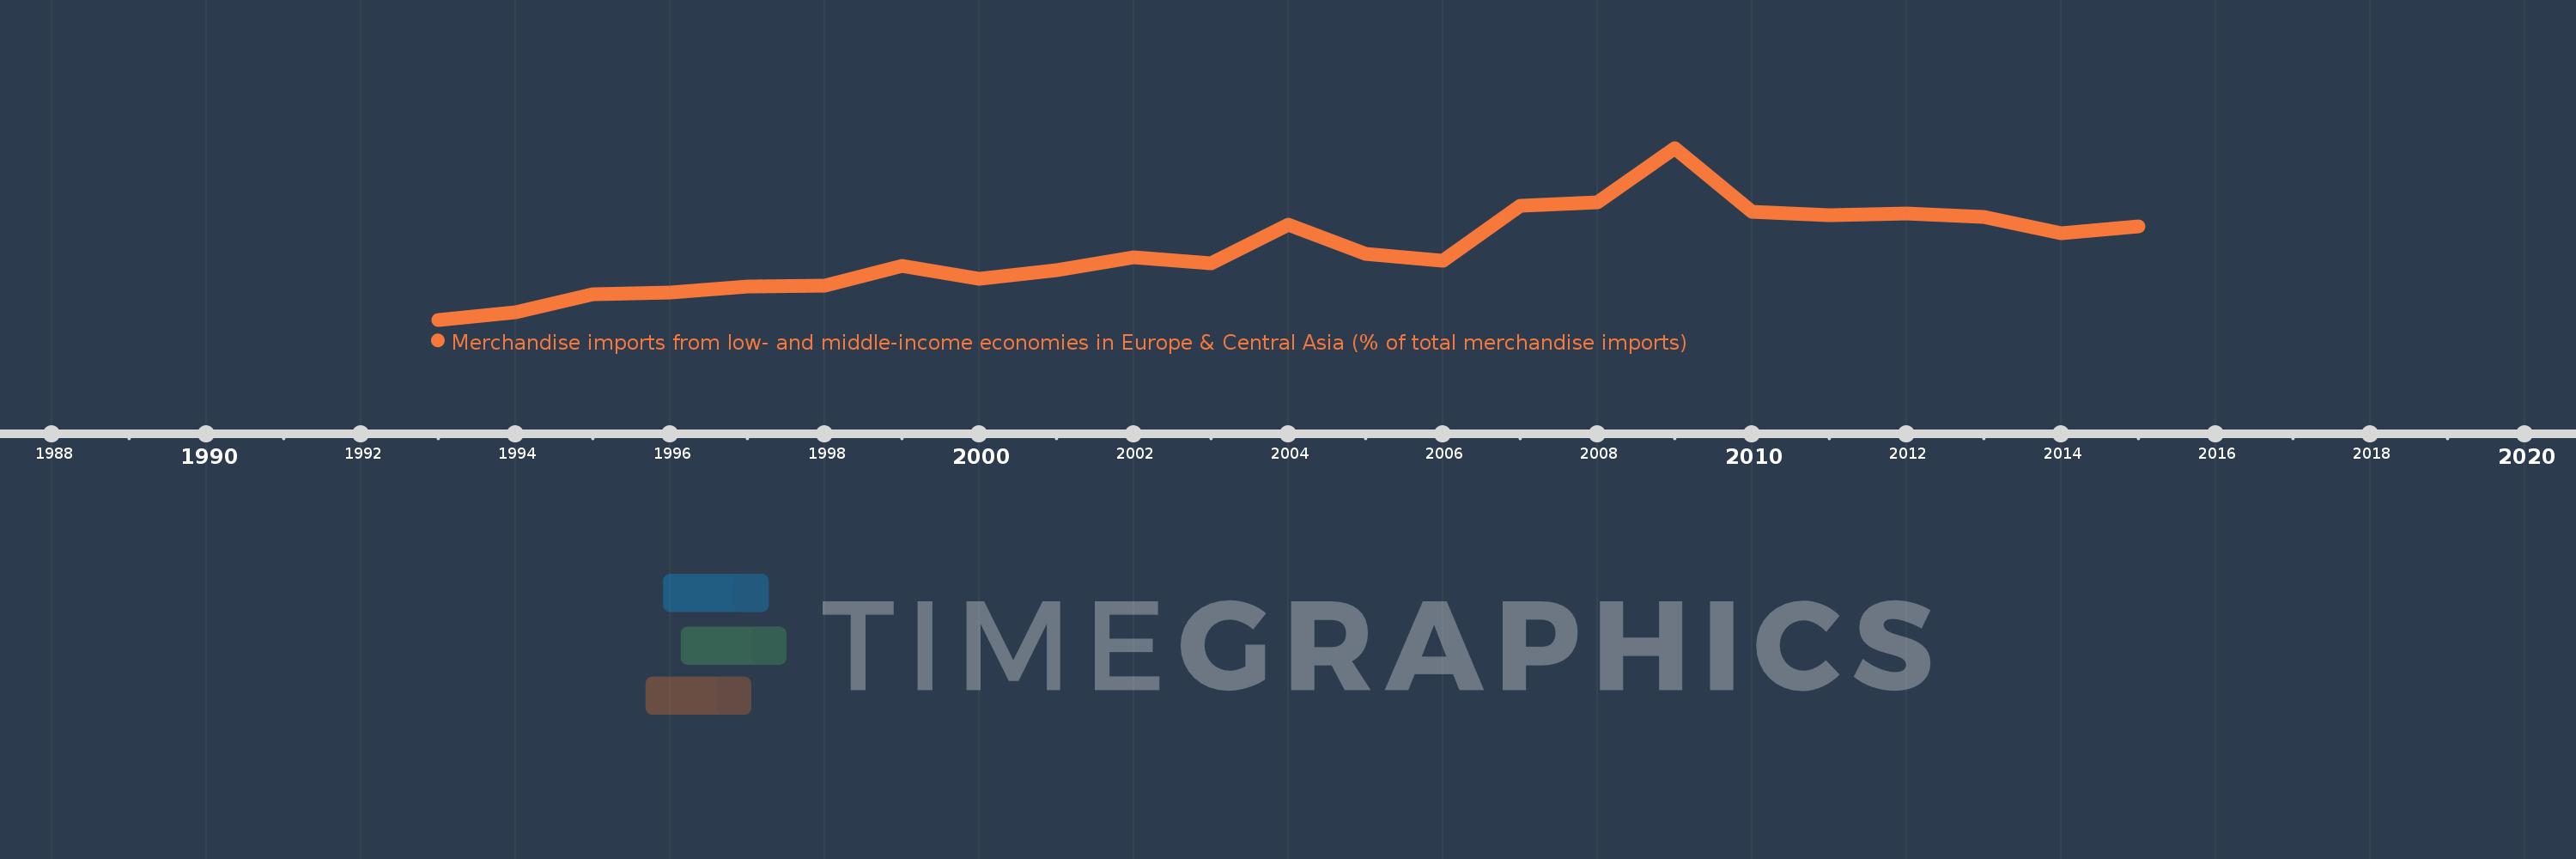
Merchandise imports from low- and middle-income economies in Europe & Central Asia (% of total merchandise imports)
2015,2014,2013,2012,2011,2010,2009,2008,2007,2006,2005,2004,2003,2002,2001,2000,1999,1998,1997,1996,1995,1994,1993
This statistics in other country:
AfghanistanAlbaniaAlgeriaArab WorldArgentinaArmeniaArubaAustraliaAustriaAzerbaijanBahamas, TheBahrainBangladeshBarbadosBelarusBelgiumBeninBoliviaBosnia and HerzegovinaBrazilBulgariaCameroonCanadaCaribbean small statesCentral Europe and the BalticsChileChinaColombiaCongo, Rep.Costa RicaCote d'IvoireCroatiaCubaCyprusCzech RepublicDenmarkEarly-demographic dividendEast Asia & PacificEast Asia & Pacific (excluding high income)East Asia & Pacific (IDA & IBRD countries)EcuadorEgypt, Arab Rep.El SalvadorEstoniaEthiopiaEuro areaEurope & Central AsiaEurope & Central Asia (excluding high income)Europe & Central Asia (IDA & IBRD countries)European UnionFinlandFragile and conflict affected situationsFranceGeorgiaGermanyGhanaGibraltarGreeceGreenlandGuatemalaGuineaHeavily indebted poor countries (HIPC)High incomeHondurasHong Kong SAR, ChinaHungaryIBRD onlyIcelandIDA & IBRD totalIDA blendIDA onlyIDA totalIndiaIndonesiaIran, Islamic Rep.IraqIrelandIsraelItalyJamaicaJapanJordanKazakhstanKenyaKorea, Dem. People’s Rep.Korea, Rep.KuwaitKyrgyz RepublicLate-demographic dividendLatin America & Caribbean Latin America & Caribbean (excluding high income)Latin America & the Caribbean (IDA & IBRD countries)LatviaLeast developed countries: UN classificationLebanonLiberiaLibyaLithuaniaLow & middle incomeLow incomeLower middle incomeLuxembourgMacao SAR, ChinaMacedonia, FYRMadagascarMalaysiaMaltaMauritaniaMauritiusMiddle East & North AfricaMiddle East & North Africa (excluding high income)Middle East & North Africa (IDA & IBRD countries)Middle incomeMoldovaMongoliaMontenegroMoroccoNetherlandsNew CaledoniaNew ZealandNigeriaNorth AmericaNorwayOECD membersOmanOther small statesPacific island small statesPakistanPanamaPeruPhilippinesPolandPortugalPost-demographic dividendPre-demographic dividendQatarRomaniaRussian FederationRwandaSaudi ArabiaSenegalSerbiaSingaporeSlovak RepublicSloveniaSmall statesSouth AfricaSouth AsiaSouth Asia (IDA & IBRD)SpainSri LankaSt. Kitts and NevisSub-Saharan Africa Sub-Saharan Africa (excluding high income)Sub-Saharan Africa (IDA & IBRD countries)SwedenSwitzerlandSyrian Arab RepublicTajikistanTanzaniaThailandTogoTongaTrinidad and TobagoTunisiaTurkeyTurkmenistanUgandaUkraineUnited Arab EmiratesUnited KingdomUnited StatesUpper middle incomeUruguayUzbekistanVenezuela, RBVietnamWorldYemen, Rep.ZambiaZimbabwe Timeline:
This timeline shows a graph from 1993 to 2015 of Other small states. No data until 1992. Number of actual observations by date: 23.
Source name:
World Development Indicators
Source organization:
World Bank staff estimates based data from International Monetary Fund's Direction of Trade database.
Categories, topics:
Private Sector, Trade
Last updated:
apr 23, 2017
Indicators value changes by year
At the date of observation
Value
Absolute change
Change from previous value
jan 1, 1993
0.09
+0.09
0.0%
jan 1, 1994
0.278
+0.188
209.57%
jan 1, 1995
0.698
+0.42
150.91%
jan 1, 1996
0.739
+0.041
5.82%
jan 1, 1997
0.879
+0.14
19.0%
jan 1, 1998
0.902
+0.023
2.65%
jan 1, 1999
1.364
+0.462
51.21%
jan 1, 2000
1.06
-0.304
-22.31%
jan 1, 2001
1.261
+0.201
18.97%
jan 1, 2002
1.572
+0.312
24.72%
jan 1, 2003
1.429
-0.144
-9.13%
jan 1, 2004
2.365
+0.936
65.49%
jan 1, 2005
1.658
-0.707
-29.9%
jan 1, 2006
1.492
-0.166
-10.01%
jan 1, 2007
2.803
+1.311
87.92%
jan 1, 2008
2.892
+0.089
3.17%
jan 1, 2009
4.182
+1.29
44.62%
jan 1, 2010
2.664
-1.518
-36.29%
jan 1, 2011
2.57
-0.094
-3.53%
jan 1, 2012
2.628
+0.057
2.23%
jan 1, 2013
2.534
-0.094
-3.58%
jan 1, 2014
2.153
-0.381
-15.03%
jan 1, 2015
2.316
+0.163
7.57%
Ranking of countries by current statistics by years


Comments: