29
/
en
AIzaSyAYiBZKx7MnpbEhh9jyipgxe19OcubqV5w
April 1, 2024
52929
OECD members
OED
false
2
1
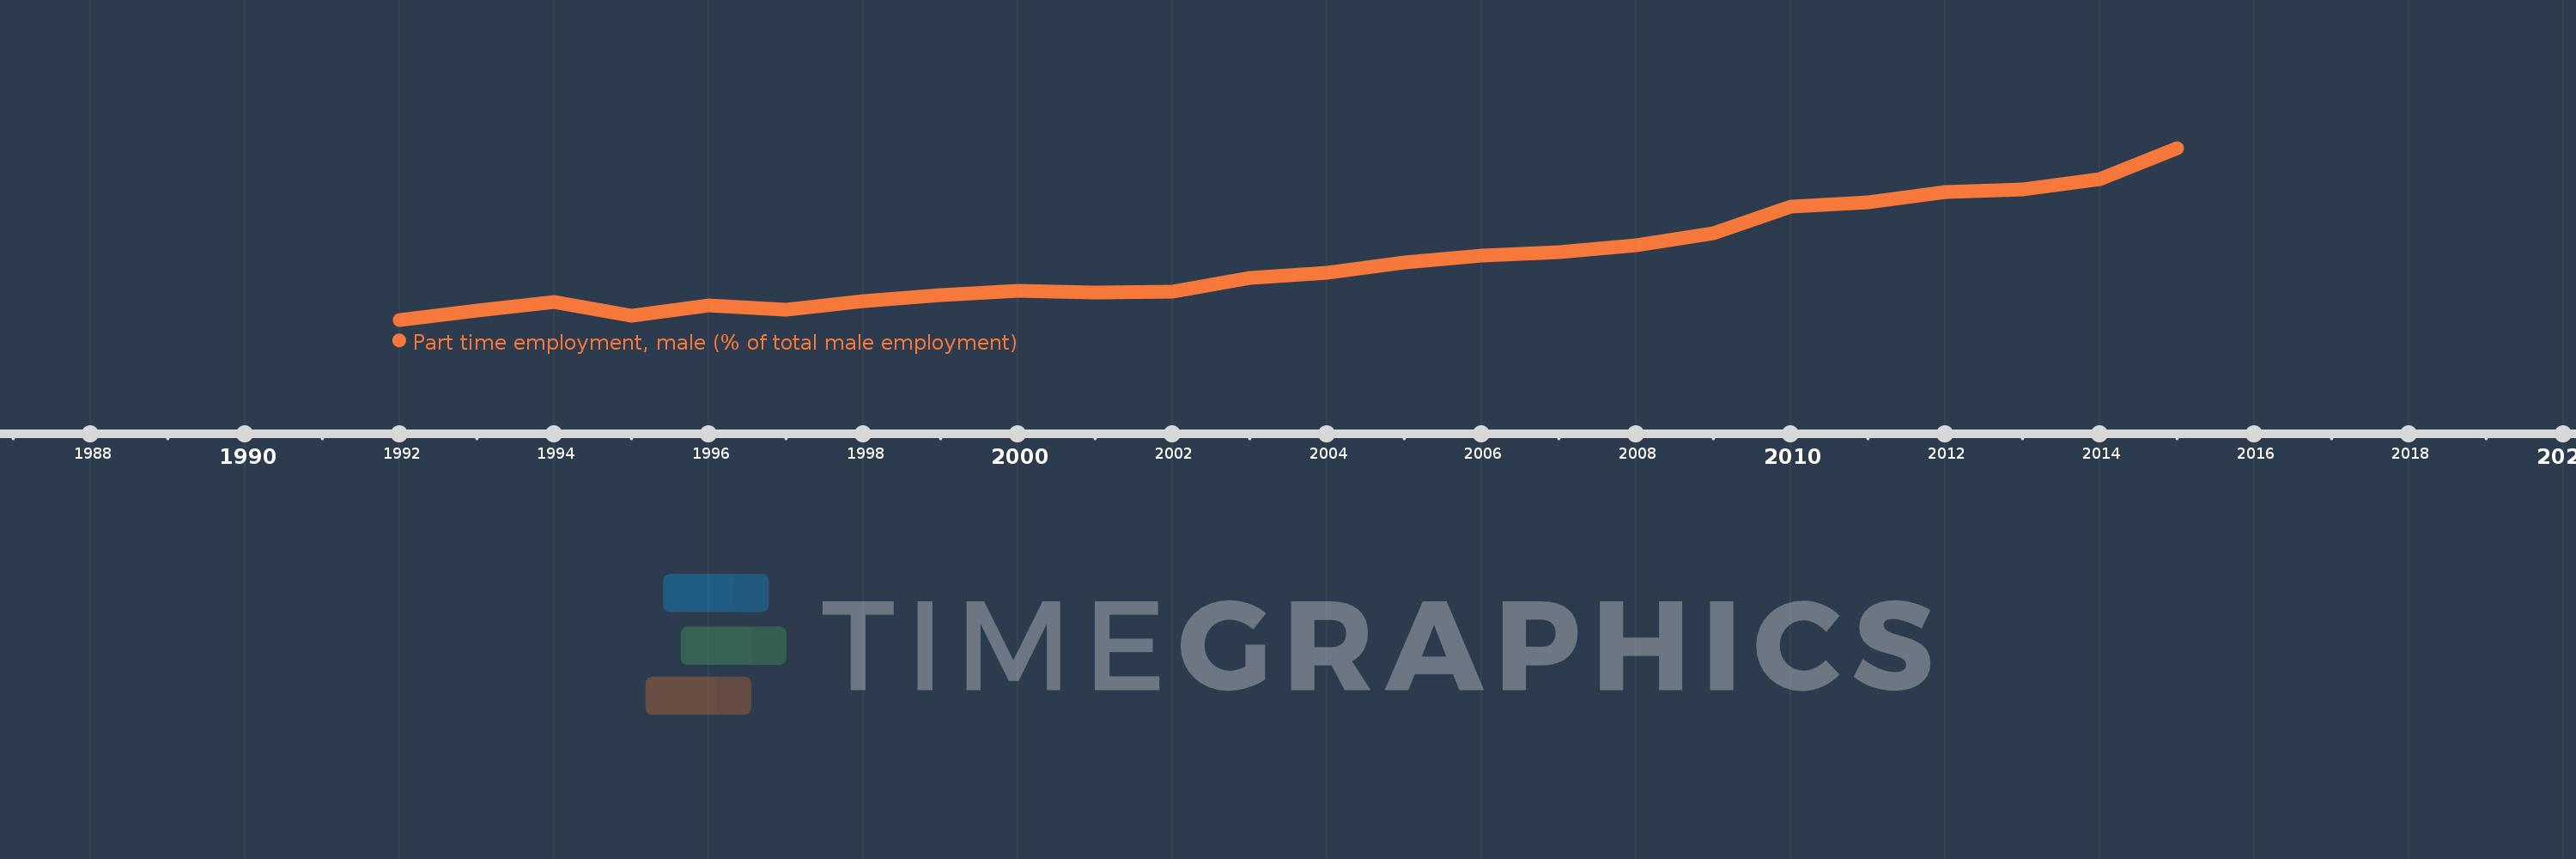
Part time employment, male (% of total male employment)
2015,2014,2013,2012,2011,2010,2009,2008,2007,2006,2005,2004,2003,2002,2001,2000,1999,1998,1997,1996,1995,1994,1993,1992
This statistics in other country:
Timeline:
This timeline shows a graph from 1992 to 2015 of OECD members. No data until 1991. Number of actual observations by date: 24.
Source name:
World Development Indicators
Source organization:
International Labour Organization, Key Indicators of the Labour Market database.
Categories, topics:
Social Protection & Labor, Gender
Last updated:
apr 23, 2017
Indicators value changes by year
At the date of observation
Value
Absolute change
Change from previous value
jan 1, 1992
5.743
+5.743
0.0%
jan 1, 1993
5.97
+0.227
3.95%
jan 1, 1994
6.175
+0.205
3.44%
jan 1, 1995
5.835
-0.34
-5.5%
jan 1, 1996
6.095
+0.26
4.45%
jan 1, 1997
6.0
-0.096
-1.57%
jan 1, 1998
6.21
+0.21
3.5%
jan 1, 1999
6.357
+0.147
2.37%
jan 1, 2000
6.455
+0.097
1.53%
jan 1, 2001
6.417
-0.038
-0.59%
jan 1, 2002
6.441
+0.024
0.37%
jan 1, 2003
6.771
+0.33
5.12%
jan 1, 2004
6.899
+0.128
1.89%
jan 1, 2005
7.15
+0.251
3.64%
jan 1, 2006
7.322
+0.172
2.4%
jan 1, 2007
7.421
+0.099
1.35%
jan 1, 2008
7.577
+0.157
2.11%
jan 1, 2009
7.889
+0.312
4.12%
jan 1, 2010
8.548
+0.658
8.35%
jan 1, 2011
8.649
+0.101
1.18%
jan 1, 2012
8.89
+0.241
2.78%
jan 1, 2013
8.957
+0.068
0.76%
jan 1, 2014
9.222
+0.265
2.96%
jan 1, 2015
9.988
+0.766
8.3%
Ranking of countries by current statistics by years


Comments: