29
/
en
AIzaSyAYiBZKx7MnpbEhh9jyipgxe19OcubqV5w
April 1, 2024
52835
OECD members
OED
false
2
1
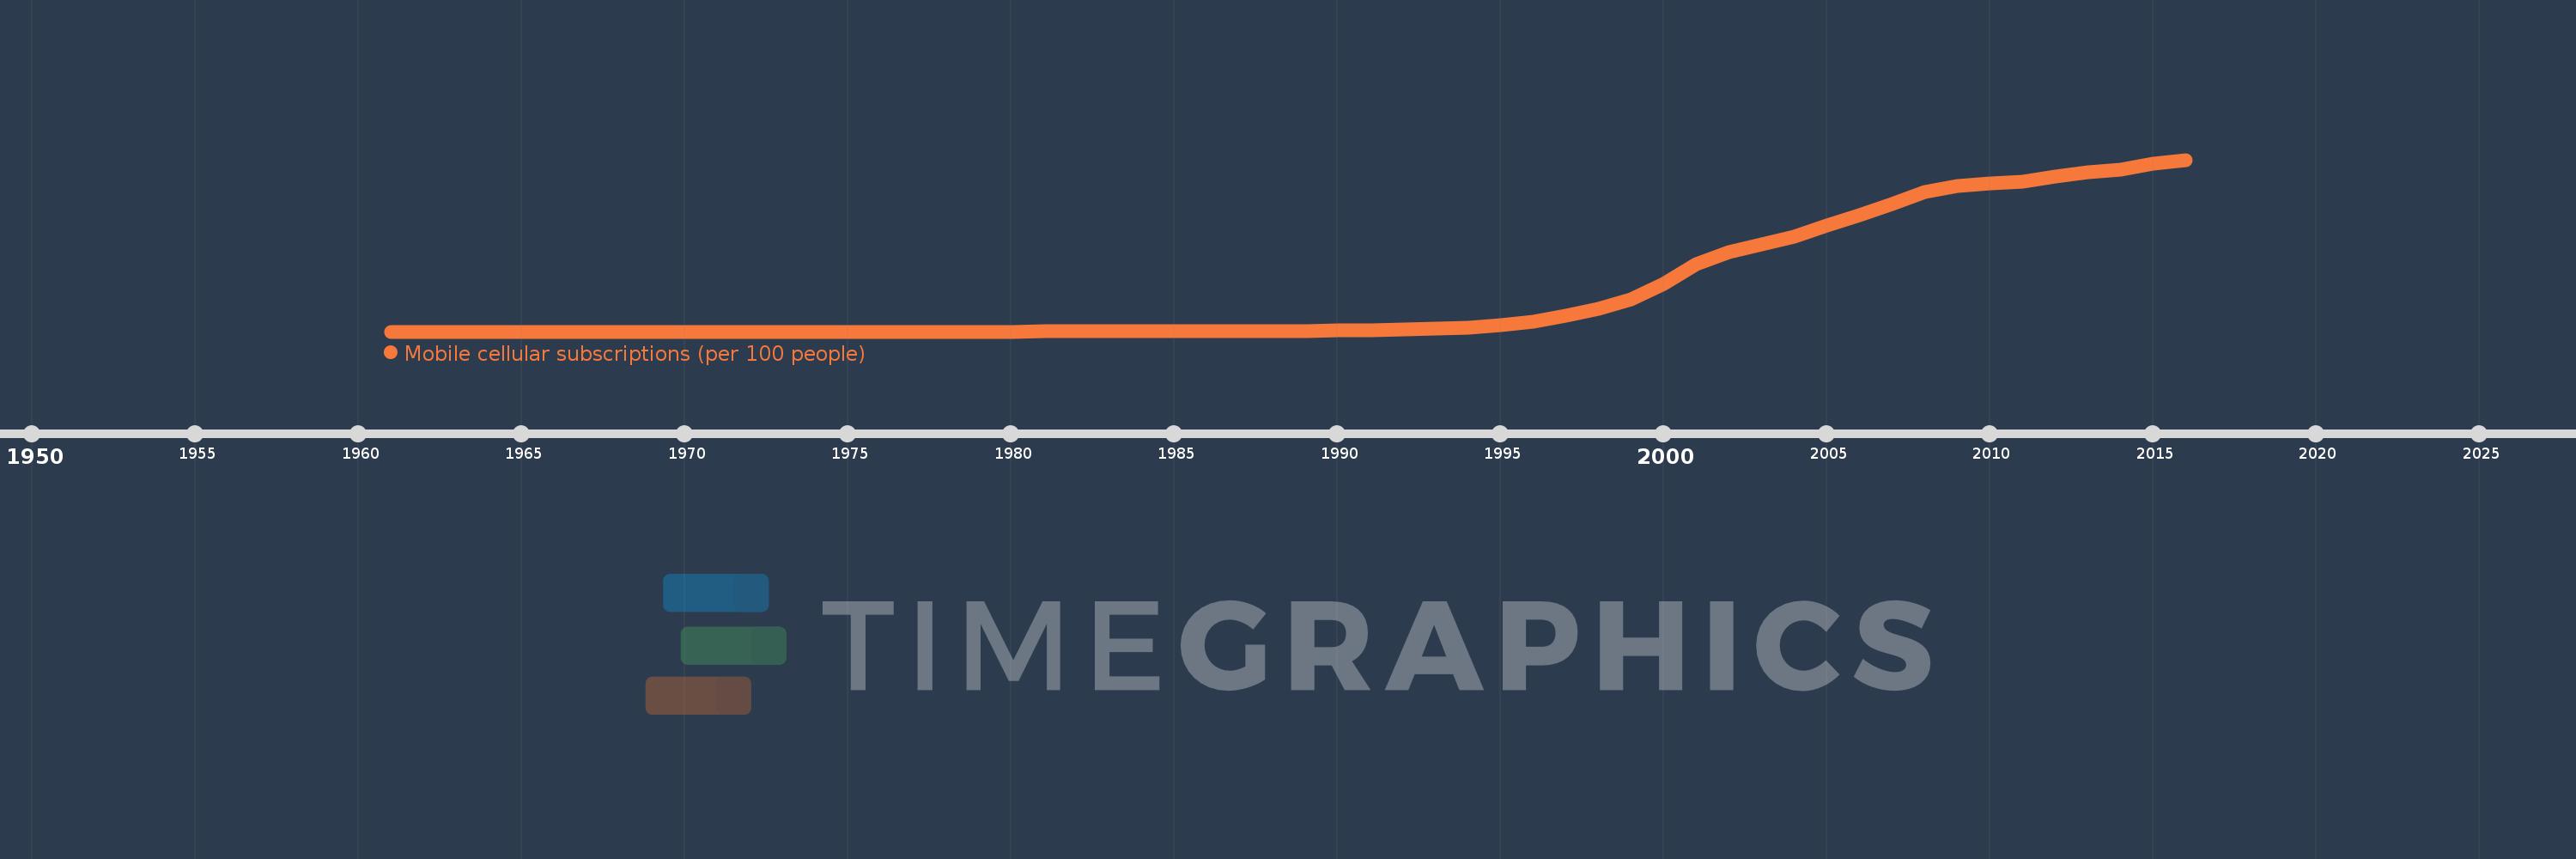
Mobile cellular subscriptions (per 100 people)
2016,2015,2014,2013,2012,2011,2010,2009,2008,2007,2006,2005,2004,2003,2002,2001,2000,1999,1998,1997,1996,1995,1994,1993,1992,1991,1990,1989,1988,1987,1986,1985,1984,1983,1982,1981,1980,1979,1978,1977,1976,1971,1966,1961
This statistics in other country:
AfghanistanAlbaniaAlgeriaAmerican SamoaAndorraAngolaAntigua and BarbudaArab WorldArgentinaArmeniaArubaAustraliaAustriaAzerbaijanBahamas, TheBahrainBangladeshBarbadosBelarusBelgiumBelizeBeninBermudaBhutanBoliviaBosnia and HerzegovinaBotswanaBrazilBritish Virgin IslandsBrunei DarussalamBulgariaBurkina FasoBurundiCabo VerdeCambodiaCameroonCanadaCaribbean small statesCayman IslandsCentral African RepublicCentral Europe and the BalticsChadChileChinaColombiaComorosCongo, Dem. Rep.Congo, Rep.Costa RicaCote d'IvoireCroatiaCubaCuracaoCyprusCzech RepublicDenmarkDjiboutiDominicaDominican RepublicEarly-demographic dividendEast Asia & PacificEast Asia & Pacific (excluding high income)East Asia & Pacific (IDA & IBRD countries)EcuadorEgypt, Arab Rep.El SalvadorEquatorial GuineaEritreaEstoniaEthiopiaEuro areaEurope & Central AsiaEurope & Central Asia (excluding high income)Europe & Central Asia (IDA & IBRD countries)European UnionFaroe IslandsFijiFinlandFragile and conflict affected situationsFranceFrench PolynesiaGabonGambia, TheGeorgiaGermanyGhanaGibraltarGreeceGreenlandGrenadaGuamGuatemalaGuineaGuinea-BissauGuyanaHaitiHeavily indebted poor countries (HIPC)High incomeHondurasHong Kong SAR, ChinaHungaryIBRD onlyIcelandIDA & IBRD totalIDA blendIDA onlyIDA totalIndiaIndonesiaIran, Islamic Rep.IraqIrelandIsraelItalyJamaicaJapanJordanKazakhstanKenyaKiribatiKorea, Dem. People’s Rep.Korea, Rep.KosovoKuwaitKyrgyz RepublicLao PDRLate-demographic dividendLatin America & Caribbean Latin America & Caribbean (excluding high income)Latin America & the Caribbean (IDA & IBRD countries)LatviaLeast developed countries: UN classificationLebanonLesothoLiberiaLibyaLiechtensteinLithuaniaLow & middle incomeLow incomeLower middle incomeLuxembourgMacao SAR, ChinaMacedonia, FYRMadagascarMalawiMalaysiaMaldivesMaliMaltaMarshall IslandsMauritaniaMauritiusMexicoMicronesia, Fed. Sts.Middle East & North AfricaMiddle East & North Africa (excluding high income)Middle East & North Africa (IDA & IBRD countries)Middle incomeMoldovaMonacoMongoliaMontenegroMoroccoMozambiqueMyanmarNamibiaNauruNepalNetherlandsNew CaledoniaNew ZealandNicaraguaNigerNigeriaNorth AmericaNorthern Mariana IslandsNorwayOECD membersOmanOther small statesPacific island small statesPakistanPalauPanamaPapua New GuineaParaguayPeruPhilippinesPolandPortugalPost-demographic dividendPre-demographic dividendPuerto RicoQatarRomaniaRussian FederationRwandaSamoaSan MarinoSao Tome and PrincipeSaudi ArabiaSenegalSerbiaSeychellesSierra LeoneSingaporeSint Maarten (Dutch part)Slovak RepublicSloveniaSmall statesSolomon IslandsSomaliaSouth AfricaSouth AsiaSouth Asia (IDA & IBRD)South SudanSpainSri LankaSt. Kitts and NevisSt. LuciaSt. Vincent and the GrenadinesSub-Saharan Africa Sub-Saharan Africa (excluding high income)Sub-Saharan Africa (IDA & IBRD countries)SudanSurinameSwazilandSwedenSwitzerlandSyrian Arab RepublicTajikistanTanzaniaThailandTimor-LesteTogoTongaTrinidad and TobagoTunisiaTurkeyTurkmenistanTurks and Caicos IslandsTuvaluUgandaUkraineUnited Arab EmiratesUnited KingdomUnited StatesUpper middle incomeUruguayUzbekistanVanuatuVenezuela, RBVietnamVirgin Islands (U.S.)West Bank and GazaWorldYemen, Rep.ZambiaZimbabwe Timeline:
This timeline shows a graph from 1961 to 2016 of OECD members. No data until 1960. Number of actual observations by date: 44.
Source name:
World Development Indicators
Source organization:
International Telecommunication Union, World Telecommunication/ICT Development Report and database.
Categories, topics:
Infrastructure
Last updated:
apr 23, 2017
Indicators value changes by year
Maximum:
115.978
jan 1, 2016
At the date of observation
Value
Absolute change
Change from previous value
jan 1, 1981
0.002
+0.002
%
jan 1, 1982
0.008
+0.006
250.48%
jan 1, 1983
0.013
+0.005
54.76%
jan 1, 1984
0.02
+0.007
52.92%
jan 1, 1985
0.034
+0.014
70.25%
jan 1, 1986
0.078
+0.044
130.85%
jan 1, 1987
0.136
+0.058
74.55%
jan 1, 1988
0.235
+0.099
73.17%
jan 1, 1989
0.396
+0.161
68.47%
jan 1, 1990
0.662
+0.266
67.34%
jan 1, 1991
0.988
+0.326
49.28%
jan 1, 1992
1.403
+0.415
42.02%
jan 1, 1993
1.952
+0.548
39.08%
jan 1, 1994
2.78
+0.828
42.43%
jan 1, 1995
4.387
+1.607
57.81%
jan 1, 1996
6.937
+2.55
58.13%
jan 1, 1997
10.831
+3.894
56.13%
jan 1, 1998
15.28
+4.449
41.08%
jan 1, 1999
21.876
+6.597
43.17%
jan 1, 2000
32.198
+10.322
47.18%
jan 1, 2001
45.242
+13.043
40.51%
jan 1, 2002
53.624
+8.382
18.53%
jan 1, 2003
58.681
+5.057
9.43%
jan 1, 2004
64.324
+5.643
9.62%
jan 1, 2005
71.436
+7.112
11.06%
jan 1, 2006
78.756
+7.32
10.25%
jan 1, 2007
86.208
+7.451
9.46%
jan 1, 2008
94.123
+7.915
9.18%
jan 1, 2009
98.197
+4.074
4.33%
jan 1, 2010
100.025
+1.828
1.86%
jan 1, 2011
101.36
+1.335
1.33%
jan 1, 2012
104.826
+3.467
3.42%
jan 1, 2013
107.4
+2.573
2.45%
jan 1, 2014
109.276
+1.877
1.75%
jan 1, 2015
113.309
+4.033
3.69%
jan 1, 2016
115.978
+2.669
2.36%
Ranking of countries by current statistics by years


Comments: