29
/
en
AIzaSyAYiBZKx7MnpbEhh9jyipgxe19OcubqV5w
April 1, 2024
52693
OECD members
OED
false
2
1
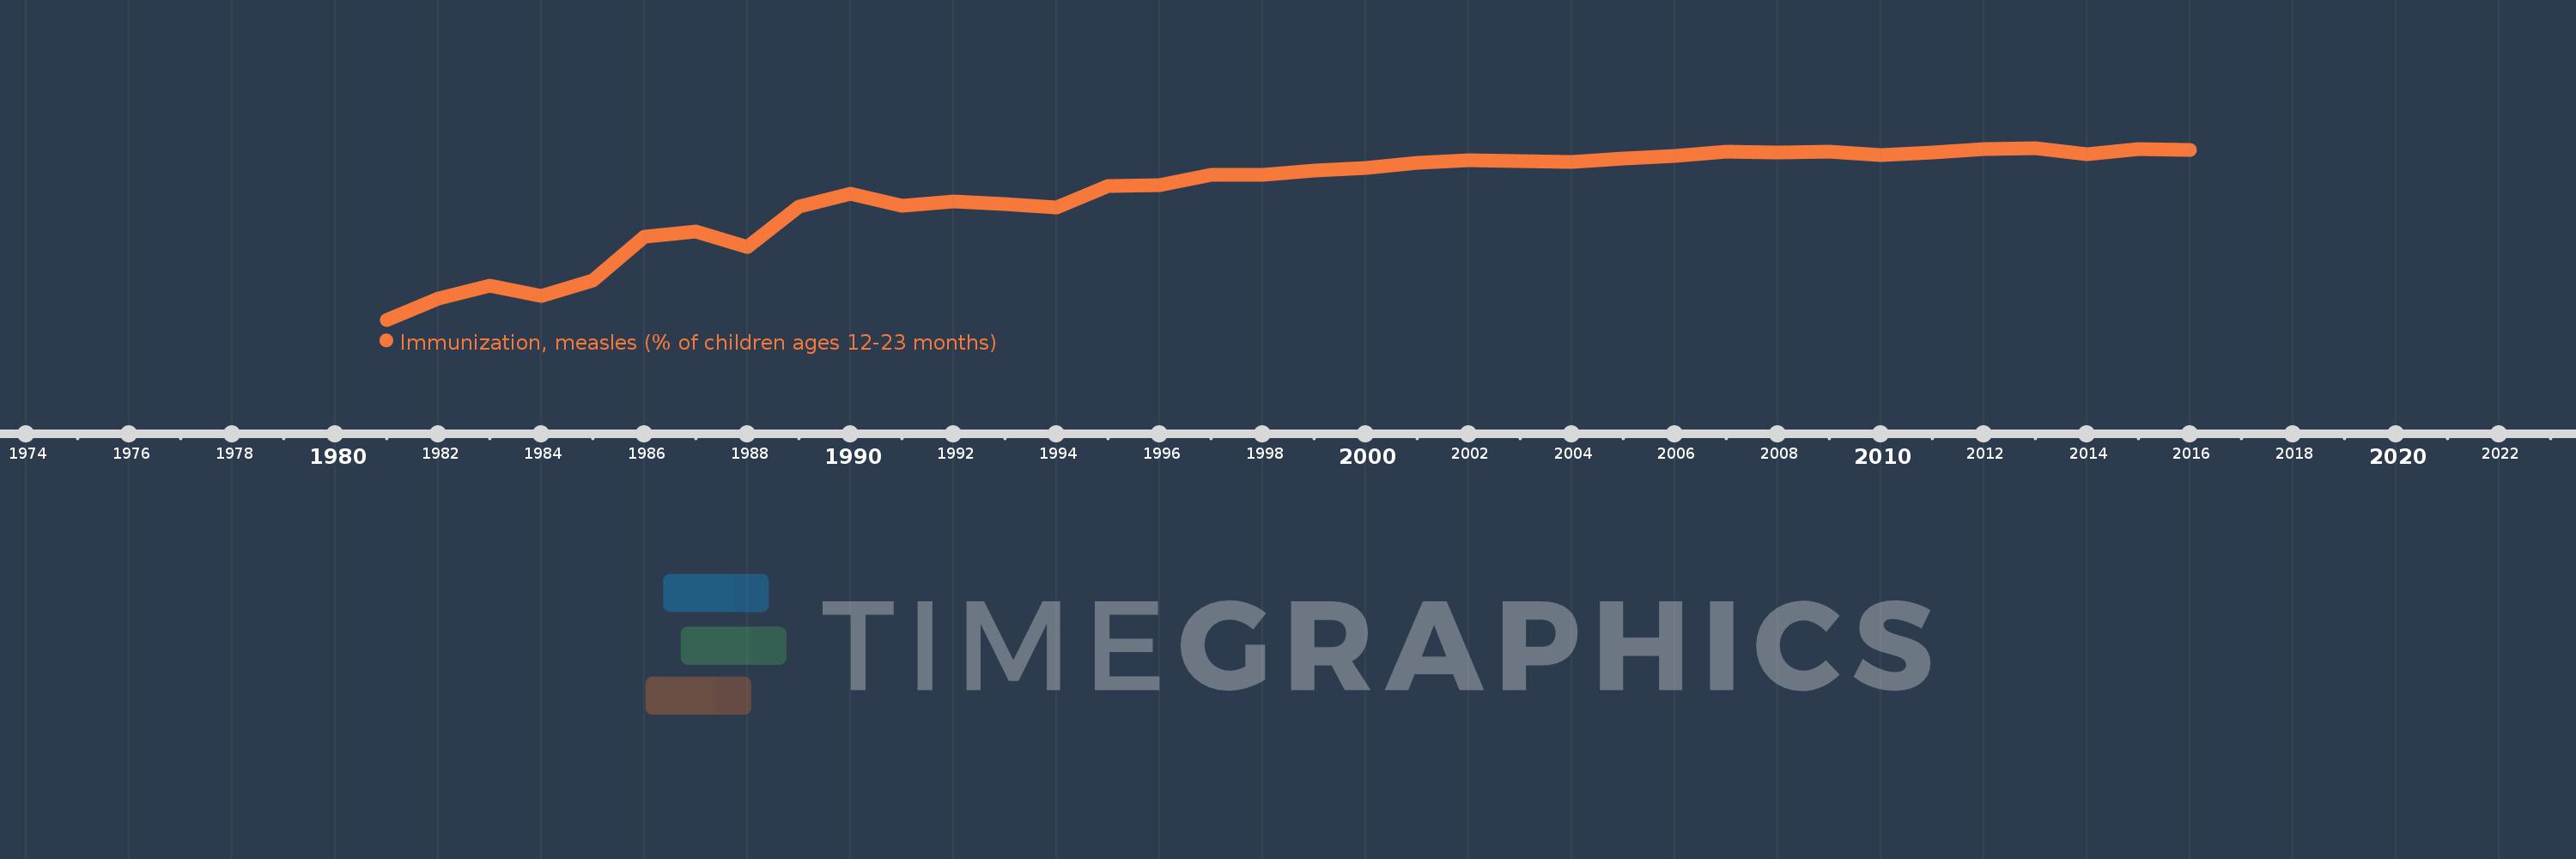
Immunization, measles (% of children ages 12-23 months)
2016,2015,2014,2013,2012,2011,2010,2009,2008,2007,2006,2005,2004,2003,2002,2001,2000,1999,1998,1997,1996,1995,1994,1993,1992,1991,1990,1989,1988,1987,1986,1985,1984,1983,1982,1981
This statistics in other country:
AfghanistanAlbaniaAlgeriaAndorraAngolaAntigua and BarbudaArab WorldArgentinaArmeniaAustraliaAustriaAzerbaijanBahamas, TheBahrainBangladeshBarbadosBelarusBelgiumBelizeBeninBhutanBoliviaBosnia and HerzegovinaBotswanaBrazilBrunei DarussalamBulgariaBurkina FasoBurundiCabo VerdeCambodiaCameroonCanadaCaribbean small statesCentral African RepublicCentral Europe and the BalticsChadChileChinaColombiaComorosCongo, Dem. Rep.Congo, Rep.Costa RicaCote d'IvoireCroatiaCubaCyprusCzech RepublicDenmarkDjiboutiDominicaDominican RepublicEarly-demographic dividendEast Asia & PacificEast Asia & Pacific (excluding high income)East Asia & Pacific (IDA & IBRD countries)EcuadorEgypt, Arab Rep.El SalvadorEquatorial GuineaEritreaEstoniaEthiopiaEuro areaEurope & Central AsiaEurope & Central Asia (excluding high income)Europe & Central Asia (IDA & IBRD countries)European UnionFijiFinlandFragile and conflict affected situationsFranceGabonGambia, TheGeorgiaGermanyGhanaGreeceGrenadaGuatemalaGuineaGuinea-BissauGuyanaHaitiHeavily indebted poor countries (HIPC)High incomeHondurasHungaryIBRD onlyIcelandIDA & IBRD totalIDA blendIDA onlyIDA totalIndiaIndonesiaIran, Islamic Rep.IraqIrelandIsraelItalyJamaicaJapanJordanKazakhstanKenyaKiribatiKorea, Dem. People’s Rep.Korea, Rep.KuwaitKyrgyz RepublicLao PDRLate-demographic dividendLatin America & Caribbean Latin America & Caribbean (excluding high income)Latin America & the Caribbean (IDA & IBRD countries)LatviaLeast developed countries: UN classificationLebanonLesothoLiberiaLibyaLithuaniaLow & middle incomeLow incomeLower middle incomeLuxembourgMacedonia, FYRMadagascarMalawiMalaysiaMaldivesMaliMaltaMarshall IslandsMauritaniaMauritiusMexicoMicronesia, Fed. Sts.Middle East & North AfricaMiddle East & North Africa (excluding high income)Middle East & North Africa (IDA & IBRD countries)Middle incomeMoldovaMonacoMongoliaMontenegroMoroccoMozambiqueMyanmarNamibiaNauruNepalNetherlandsNew ZealandNicaraguaNigerNigeriaNorth AmericaNorwayOECD membersOmanOther small statesPacific island small statesPakistanPalauPanamaPapua New GuineaParaguayPeruPhilippinesPolandPortugalPost-demographic dividendPre-demographic dividendQatarRomaniaRussian FederationRwandaSamoaSan MarinoSao Tome and PrincipeSaudi ArabiaSenegalSerbiaSeychellesSierra LeoneSingaporeSlovak RepublicSloveniaSmall statesSolomon IslandsSomaliaSouth AfricaSouth AsiaSouth Asia (IDA & IBRD)South SudanSpainSri LankaSt. Kitts and NevisSt. LuciaSt. Vincent and the GrenadinesSub-Saharan Africa Sub-Saharan Africa (excluding high income)Sub-Saharan Africa (IDA & IBRD countries)SudanSurinameSwazilandSwedenSwitzerlandSyrian Arab RepublicTajikistanTanzaniaThailandTimor-LesteTogoTongaTrinidad and TobagoTunisiaTurkeyTurkmenistanTuvaluUgandaUkraineUnited Arab EmiratesUnited KingdomUnited StatesUpper middle incomeUruguayUzbekistanVanuatuVenezuela, RBVietnamWorldYemen, Rep.ZambiaZimbabwe Timeline:
This timeline shows a graph from 1981 to 2016 of OECD members. No data until 1980. Number of actual observations by date: 36.
Source name:
World Development Indicators
Source organization:
WHO and UNICEF (http://www.who.int/immunization/monitoring_surveillance/en/).
Categories, topics:
Health
Last updated:
apr 23, 2017
Indicators value changes by year
Minimum:
57.824
jan 1, 1981
Maximum:
94.527
jan 1, 2013
At the date of observation
Value
Absolute change
Change from previous value
jan 1, 1981
57.824
+57.824
0.0%
jan 1, 1982
62.374
+4.55
7.87%
jan 1, 1983
65.074
+2.7
4.33%
jan 1, 1984
62.843
-2.23
-3.43%
jan 1, 1985
66.191
+3.348
5.33%
jan 1, 1986
75.56
+9.369
14.15%
jan 1, 1987
76.729
+1.169
1.55%
jan 1, 1988
73.297
-3.432
-4.47%
jan 1, 1989
81.974
+8.677
11.84%
jan 1, 1990
84.815
+2.841
3.47%
jan 1, 1991
82.113
-2.702
-3.19%
jan 1, 1992
83.112
+0.999
1.22%
jan 1, 1993
82.585
-0.527
-0.63%
jan 1, 1994
81.865
-0.72
-0.87%
jan 1, 1995
86.442
+4.577
5.59%
jan 1, 1996
86.579
+0.137
0.16%
jan 1, 1997
88.729
+2.151
2.48%
jan 1, 1998
88.844
+0.115
0.13%
jan 1, 1999
89.713
+0.869
0.98%
jan 1, 2000
90.269
+0.556
0.62%
jan 1, 2001
91.376
+1.107
1.23%
jan 1, 2002
91.912
+0.536
0.59%
jan 1, 2003
91.665
-0.247
-0.27%
jan 1, 2004
91.615
-0.05
-0.05%
jan 1, 2005
92.292
+0.677
0.74%
jan 1, 2006
92.884
+0.592
0.64%
jan 1, 2007
93.785
+0.901
0.97%
jan 1, 2008
93.534
-0.251
-0.27%
jan 1, 2009
93.651
+0.117
0.12%
jan 1, 2010
92.947
-0.704
-0.75%
jan 1, 2011
93.587
+0.64
0.69%
jan 1, 2012
94.211
+0.624
0.67%
jan 1, 2013
94.527
+0.316
0.34%
jan 1, 2014
93.149
-1.378
-1.46%
jan 1, 2015
94.337
+1.189
1.28%
jan 1, 2016
94.145
-0.192
-0.2%
Ranking of countries by current statistics by years


Comments: