29
/
en
AIzaSyAYiBZKx7MnpbEhh9jyipgxe19OcubqV5w
April 1, 2024
52171
North America
NAC
false
2
1
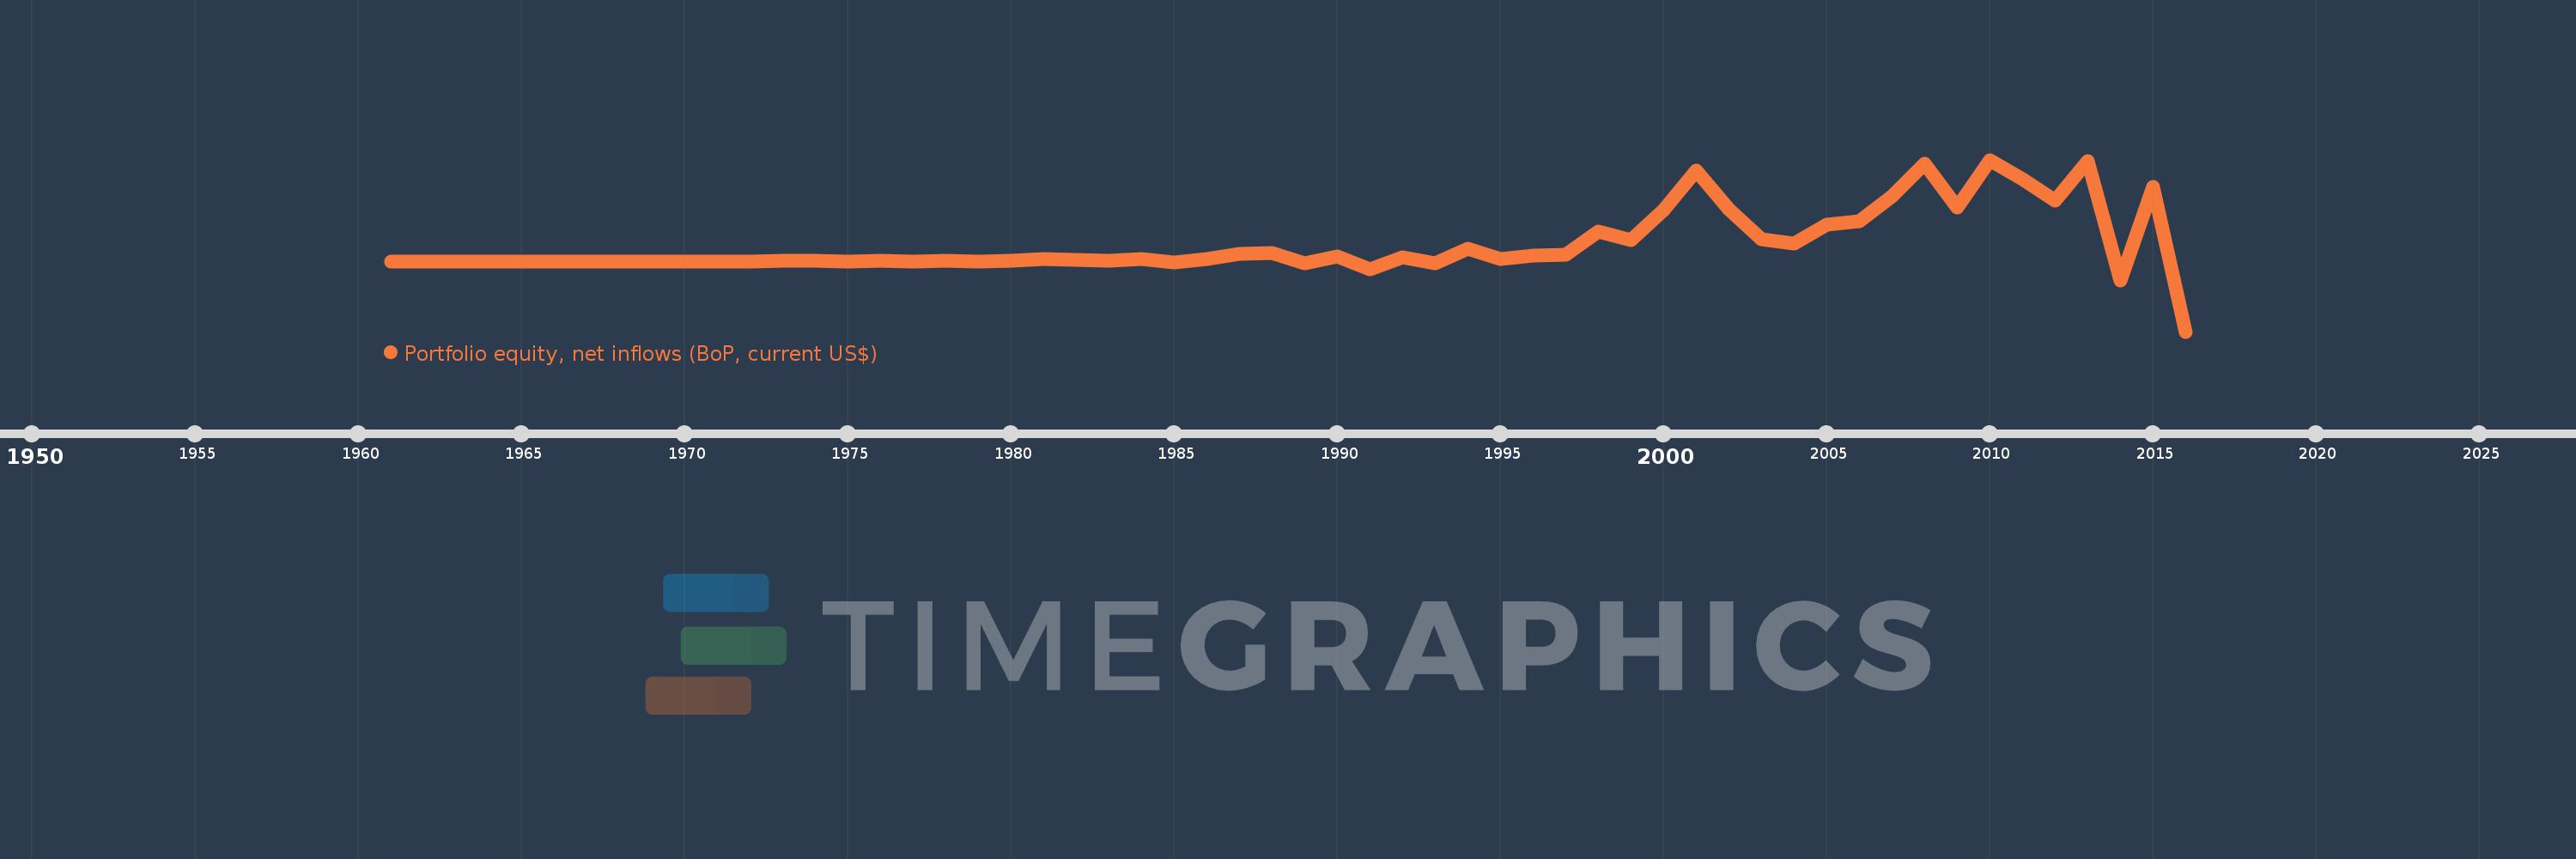
Portfolio equity, net inflows (BoP, current US$)
2016,2015,2014,2013,2012,2011,2010,2009,2008,2007,2006,2005,2004,2003,2002,2001,2000,1999,1998,1997,1996,1995,1994,1993,1992,1991,1990,1989,1988,1987,1986,1985,1984,1983,1982,1981,1980,1979,1978,1977,1976,1975,1974,1973,1972,1971,1970,1969,1968,1967,1966,1965,1964,1963,1962,1961
This statistics in other country:
AfghanistanAlbaniaAlgeriaAngolaAntigua and BarbudaArab WorldArgentinaArmeniaArubaAustraliaAustriaAzerbaijanBahamas, TheBahrainBangladeshBarbadosBelarusBelgiumBelizeBeninBermudaBhutanBoliviaBosnia and HerzegovinaBotswanaBrazilBulgariaBurkina FasoBurundiCabo VerdeCambodiaCameroonCanadaCaribbean small statesCentral African RepublicCentral Europe and the BalticsChadChileChinaColombiaComorosCongo, Dem. Rep.Congo, Rep.Costa RicaCote d'IvoireCroatiaCuracaoCyprusCzech RepublicDenmarkDjiboutiDominicaDominican RepublicEarly-demographic dividendEast Asia & PacificEast Asia & Pacific (excluding high income)East Asia & Pacific (IDA & IBRD countries)EcuadorEgypt, Arab Rep.El SalvadorEquatorial GuineaEstoniaEthiopiaEuro areaEurope & Central AsiaEurope & Central Asia (excluding high income)Europe & Central Asia (IDA & IBRD countries)European UnionFijiFinlandFragile and conflict affected situationsFranceFrench PolynesiaGabonGambia, TheGeorgiaGermanyGhanaGreeceGrenadaGuatemalaGuineaGuinea-BissauGuyanaHaitiHeavily indebted poor countries (HIPC)High incomeHondurasHong Kong SAR, ChinaHungaryIBRD onlyIcelandIDA & IBRD totalIDA blendIDA onlyIDA totalIndiaIndonesiaIran, Islamic Rep.IraqIrelandIsraelItalyJamaicaJapanJordanKazakhstanKenyaKiribatiKorea, Rep.KosovoKuwaitKyrgyz RepublicLao PDRLate-demographic dividendLatin America & Caribbean Latin America & Caribbean (excluding high income)Latin America & the Caribbean (IDA & IBRD countries)LatviaLeast developed countries: UN classificationLebanonLesothoLiberiaLibyaLithuaniaLow & middle incomeLow incomeLower middle incomeLuxembourgMacao SAR, ChinaMacedonia, FYRMadagascarMalawiMalaysiaMaldivesMaliMaltaMarshall IslandsMauritaniaMauritiusMexicoMiddle East & North AfricaMiddle East & North Africa (excluding high income)Middle East & North Africa (IDA & IBRD countries)Middle incomeMoldovaMongoliaMontenegroMoroccoMozambiqueMyanmarNamibiaNepalNetherlandsNew CaledoniaNew ZealandNicaraguaNigerNigeriaNorth AmericaNorwayOECD membersOmanOther small statesPacific island small statesPakistanPanamaPapua New GuineaParaguayPeruPhilippinesPolandPortugalPost-demographic dividendPre-demographic dividendQatarRomaniaRussian FederationRwandaSamoaSao Tome and PrincipeSaudi ArabiaSenegalSerbiaSeychellesSierra LeoneSingaporeSlovak RepublicSloveniaSmall statesSolomon IslandsSomaliaSouth AfricaSouth AsiaSouth Asia (IDA & IBRD)SpainSri LankaSt. Kitts and NevisSt. LuciaSt. Vincent and the GrenadinesSub-Saharan Africa Sub-Saharan Africa (excluding high income)Sub-Saharan Africa (IDA & IBRD countries)SudanSurinameSwazilandSwedenSwitzerlandSyrian Arab RepublicTajikistanTanzaniaThailandTimor-LesteTogoTongaTrinidad and TobagoTunisiaTurkeyUgandaUkraineUnited KingdomUnited StatesUpper middle incomeUruguayVanuatuVenezuela, RBVietnamWest Bank and GazaWorldYemen, Rep.ZambiaZimbabwe Timeline:
This timeline shows a graph from 1961 to 2016 of North America. No data until 1960. Number of actual observations by date: 56.
Source name:
World Development Indicators
Source organization:
International Monetary Fund, Balance of Payments database, and World Bank, International Debt Statistics.
Categories, topics:
Economy & Growth, Financial Sector, External Debt
Last updated:
apr 23, 2017
Indicators value changes by year
Minimum:
-166.694 bln
jan 1, 2016
Maximum:
242.696 bln
jan 1, 2010
At the date of observation
Value
Absolute change
Change from previous value
jan 1, 1961
70.257 mln
+70.257 mln
0.0%
jan 1, 1962
29.419 mln
-40.838 mln
-58.13%
jan 1, 1963
-116.643 mln
-146.062 mln
-496.49%
jan 1, 1964
-218.929 mln
-102.286 mln
87.69%
jan 1, 1965
-124.225 mln
+94.704 mln
-43.26%
jan 1, 1966
-238.438 mln
-114.213 mln
91.94%
jan 1, 1967
-76.933 mln
+161.506 mln
-67.73%
jan 1, 1968
44.826 mln
+121.759 mln
-158.27%
jan 1, 1969
163.572 mln
+118.746 mln
264.9%
jan 1, 1970
244.3 mln
+80.728 mln
49.35%
jan 1, 1971
624.098 mln
+379.798 mln
155.46%
jan 1, 1972
716.267 mln
+92.169 mln
14.77%
jan 1, 1973
2.406 bln
+1.69 bln
235.89%
jan 1, 1974
2.773 bln
+367.159 mln
15.26%
jan 1, 1975
108.252 mln
-2.665 bln
-96.1%
jan 1, 1976
3.135 bln
+3.027 bln
2.8K%
jan 1, 1977
802.655 mln
-2.332 bln
-74.4%
jan 1, 1978
1.223 bln
+419.977 mln
52.32%
jan 1, 1979
1.075 bln
-147.785 mln
-12.09%
jan 1, 1980
1.501 bln
+425.716 mln
39.61%
jan 1, 1981
5.523 bln
+4.022 bln
268.03%
jan 1, 1982
4.292 bln
-1.231 bln
-22.29%
jan 1, 1983
3.06 bln
-1.231 bln
-28.69%
jan 1, 1984
6.725 bln
+3.665 bln
119.76%
jan 1, 1985
-1.163 bln
-7.888 bln
-117.3%
jan 1, 1986
5.463 bln
+6.626 bln
-569.64%
jan 1, 1987
19.24 bln
+13.776 bln
252.17%
jan 1, 1988
19.999 bln
+759.558 mln
3.95%
jan 1, 1989
-4.812 bln
-24.811 bln
-124.06%
jan 1, 1990
12.277 bln
+17.089 bln
-355.16%
jan 1, 1991
-17.462 bln
-29.739 bln
-242.23%
jan 1, 1992
9.564 bln
+27.026 bln
-154.77%
jan 1, 1993
-4.78 bln
-14.344 bln
-149.98%
jan 1, 1994
30.274 bln
+35.054 bln
-733.38%
jan 1, 1995
5.608 bln
-24.666 bln
-81.48%
jan 1, 1996
13.446 bln
+7.837 bln
139.75%
jan 1, 1997
16.957 bln
+3.511 bln
26.11%
jan 1, 1998
72.494 bln
+55.538 bln
327.53%
jan 1, 1999
51.603 bln
-20.892 bln
-28.82%
jan 1, 2000
122.011 bln
+70.408 bln
136.44%
jan 1, 2001
217.839 bln
+95.828 bln
78.54%
jan 1, 2002
124.177 bln
-93.662 bln
-43.0%
jan 1, 2003
53.153 bln
-71.024 bln
-57.2%
jan 1, 2004
43.928 bln
-9.225 bln
-17.36%
jan 1, 2005
88.933 bln
+45.005 bln
102.45%
jan 1, 2006
96.823 bln
+7.89 bln
8.87%
jan 1, 2007
155.045 bln
+58.223 bln
60.13%
jan 1, 2008
233.74 bln
+78.695 bln
50.76%
jan 1, 2009
129.949 bln
-103.791 bln
-44.4%
jan 1, 2010
242.696 bln
+112.747 bln
86.76%
jan 1, 2011
196.984 bln
-45.712 bln
-18.84%
jan 1, 2012
144.661 bln
-52.323 bln
-26.56%
jan 1, 2013
240.003 bln
+95.342 bln
65.91%
jan 1, 2014
-44.749 bln
-284.752 bln
-118.65%
jan 1, 2015
177.381 bln
+222.13 bln
-496.39%
jan 1, 2016
-166.694 bln
-344.075 bln
-193.97%
Ranking of countries by current statistics by years


Comments: