29
/
en
AIzaSyAYiBZKx7MnpbEhh9jyipgxe19OcubqV5w
April 1, 2024
52056
North America
NAC
false
2
1
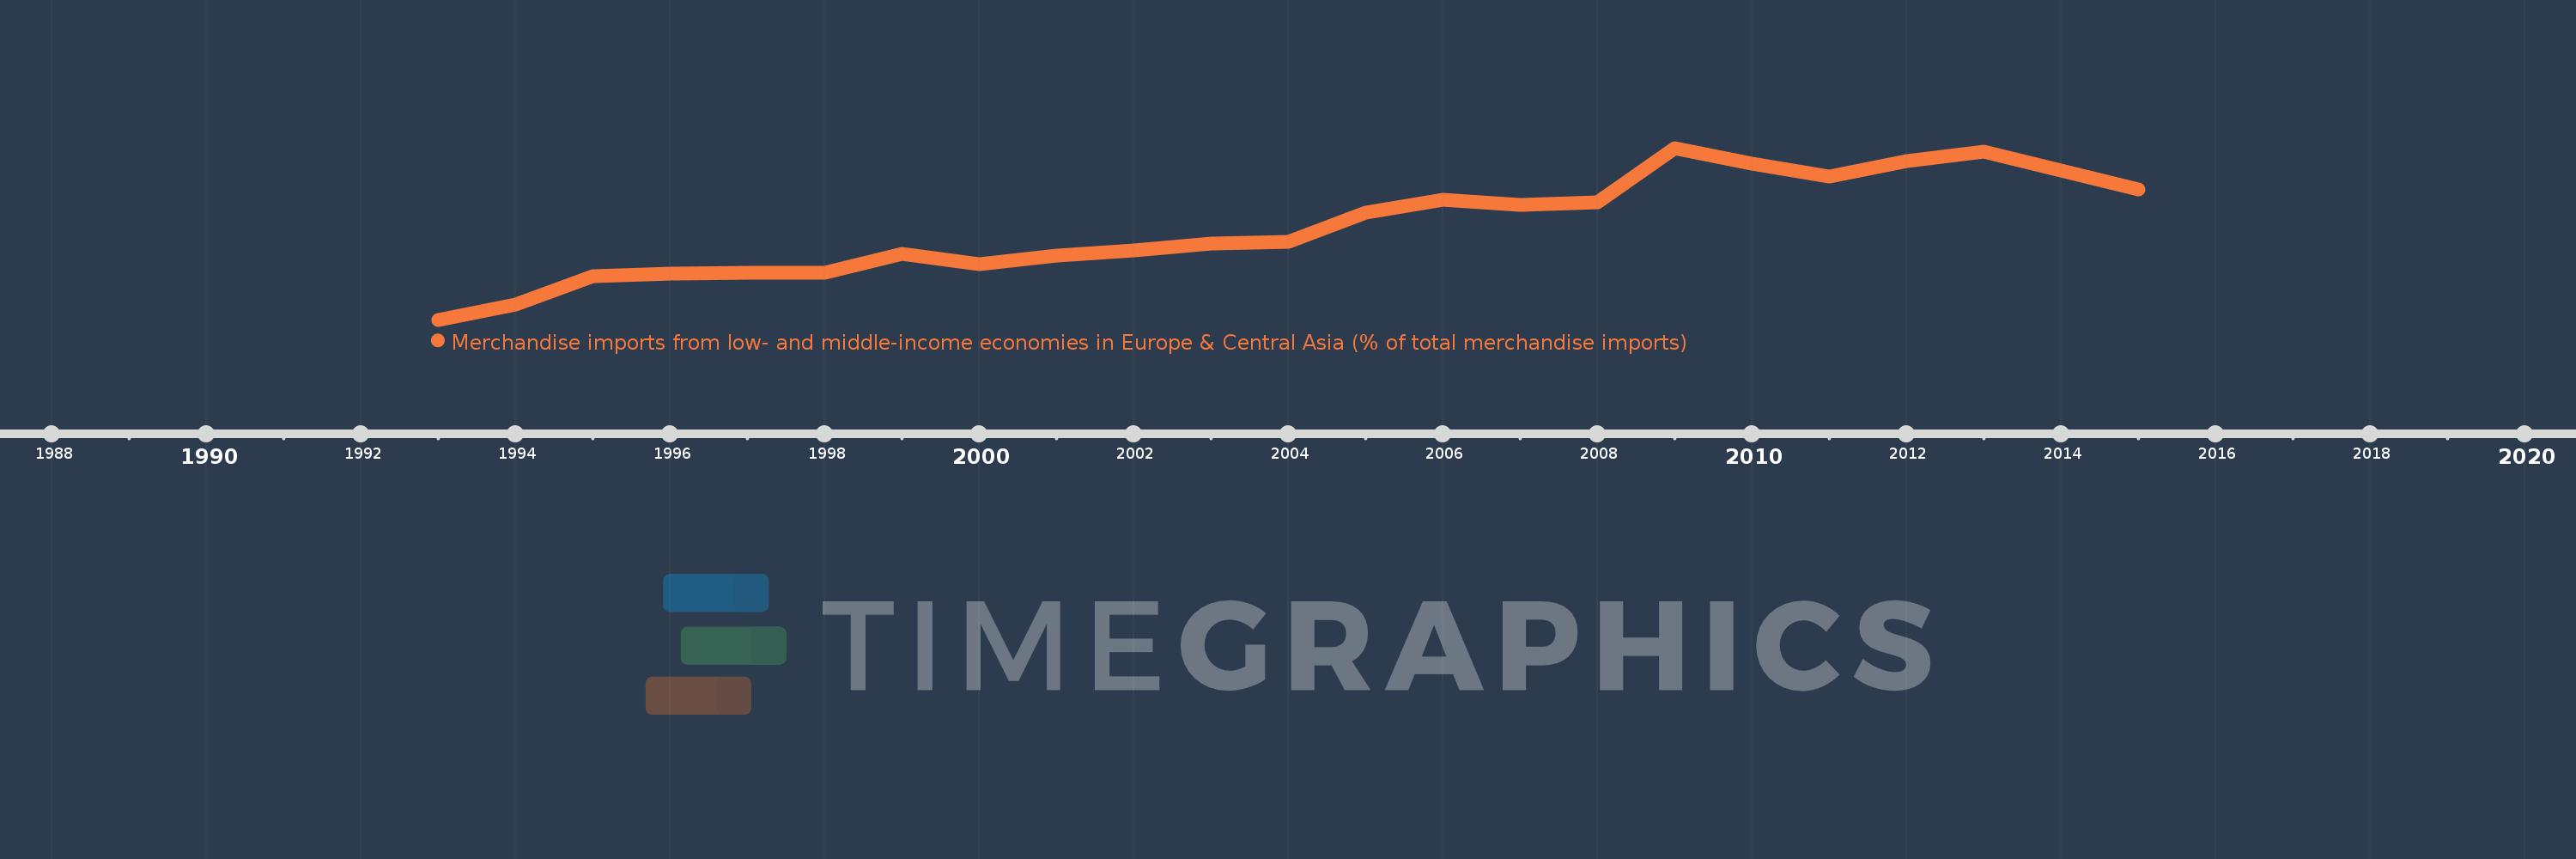
Merchandise imports from low- and middle-income economies in Europe & Central Asia (% of total merchandise imports)
2015,2014,2013,2012,2011,2010,2009,2008,2007,2006,2005,2004,2003,2002,2001,2000,1999,1998,1997,1996,1995,1994,1993
This statistics in other country:
AfghanistanAlbaniaAlgeriaArab WorldArgentinaArmeniaArubaAustraliaAustriaAzerbaijanBahamas, TheBahrainBangladeshBarbadosBelarusBelgiumBeninBoliviaBosnia and HerzegovinaBrazilBulgariaCameroonCanadaCaribbean small statesCentral Europe and the BalticsChileChinaColombiaCongo, Rep.Costa RicaCote d'IvoireCroatiaCubaCyprusCzech RepublicDenmarkEarly-demographic dividendEast Asia & PacificEast Asia & Pacific (excluding high income)East Asia & Pacific (IDA & IBRD countries)EcuadorEgypt, Arab Rep.El SalvadorEstoniaEthiopiaEuro areaEurope & Central AsiaEurope & Central Asia (excluding high income)Europe & Central Asia (IDA & IBRD countries)European UnionFinlandFragile and conflict affected situationsFranceGeorgiaGermanyGhanaGibraltarGreeceGreenlandGuatemalaGuineaHeavily indebted poor countries (HIPC)High incomeHondurasHong Kong SAR, ChinaHungaryIBRD onlyIcelandIDA & IBRD totalIDA blendIDA onlyIDA totalIndiaIndonesiaIran, Islamic Rep.IraqIrelandIsraelItalyJamaicaJapanJordanKazakhstanKenyaKorea, Dem. People’s Rep.Korea, Rep.KuwaitKyrgyz RepublicLate-demographic dividendLatin America & Caribbean Latin America & Caribbean (excluding high income)Latin America & the Caribbean (IDA & IBRD countries)LatviaLeast developed countries: UN classificationLebanonLiberiaLibyaLithuaniaLow & middle incomeLow incomeLower middle incomeLuxembourgMacao SAR, ChinaMacedonia, FYRMadagascarMalaysiaMaltaMauritaniaMauritiusMiddle East & North AfricaMiddle East & North Africa (excluding high income)Middle East & North Africa (IDA & IBRD countries)Middle incomeMoldovaMongoliaMontenegroMoroccoNetherlandsNew CaledoniaNew ZealandNigeriaNorth AmericaNorwayOECD membersOmanOther small statesPacific island small statesPakistanPanamaPeruPhilippinesPolandPortugalPost-demographic dividendPre-demographic dividendQatarRomaniaRussian FederationRwandaSaudi ArabiaSenegalSerbiaSingaporeSlovak RepublicSloveniaSmall statesSouth AfricaSouth AsiaSouth Asia (IDA & IBRD)SpainSri LankaSt. Kitts and NevisSub-Saharan Africa Sub-Saharan Africa (excluding high income)Sub-Saharan Africa (IDA & IBRD countries)SwedenSwitzerlandSyrian Arab RepublicTajikistanTanzaniaThailandTogoTongaTrinidad and TobagoTunisiaTurkeyTurkmenistanUgandaUkraineUnited Arab EmiratesUnited KingdomUnited StatesUpper middle incomeUruguayUzbekistanVenezuela, RBVietnamWorldYemen, Rep.ZambiaZimbabwe Timeline:
This timeline shows a graph from 1993 to 2015 of North America. No data until 1992. Number of actual observations by date: 23.
Source name:
World Development Indicators
Source organization:
World Bank staff estimates based data from International Monetary Fund's Direction of Trade database.
Categories, topics:
Private Sector, Trade
Last updated:
apr 23, 2017
Indicators value changes by year
At the date of observation
Value
Absolute change
Change from previous value
jan 1, 1993
0.222
+0.222
0.0%
jan 1, 1994
0.27
+0.048
21.55%
jan 1, 1995
0.358
+0.088
32.56%
jan 1, 1996
0.368
+0.009
2.62%
jan 1, 1997
0.371
+0.003
0.82%
jan 1, 1998
0.37
0.0
-0.11%
jan 1, 1999
0.429
+0.058
15.79%
jan 1, 2000
0.396
-0.033
-7.74%
jan 1, 2001
0.425
+0.029
7.45%
jan 1, 2002
0.44
+0.015
3.56%
jan 1, 2003
0.463
+0.022
5.06%
jan 1, 2004
0.468
+0.006
1.21%
jan 1, 2005
0.558
+0.089
19.11%
jan 1, 2006
0.6
+0.043
7.68%
jan 1, 2007
0.584
-0.016
-2.66%
jan 1, 2008
0.591
+0.007
1.13%
jan 1, 2009
0.763
+0.172
29.05%
jan 1, 2010
0.714
-0.049
-6.41%
jan 1, 2011
0.674
-0.04
-5.57%
jan 1, 2012
0.721
+0.047
7.04%
jan 1, 2013
0.752
+0.031
4.27%
jan 1, 2014
0.693
-0.06
-7.92%
jan 1, 2015
0.632
-0.06
-8.71%
Ranking of countries by current statistics by years


Comments: