29
/
en
AIzaSyAYiBZKx7MnpbEhh9jyipgxe19OcubqV5w
April 1, 2024
51791
North America
NAC
false
2
1
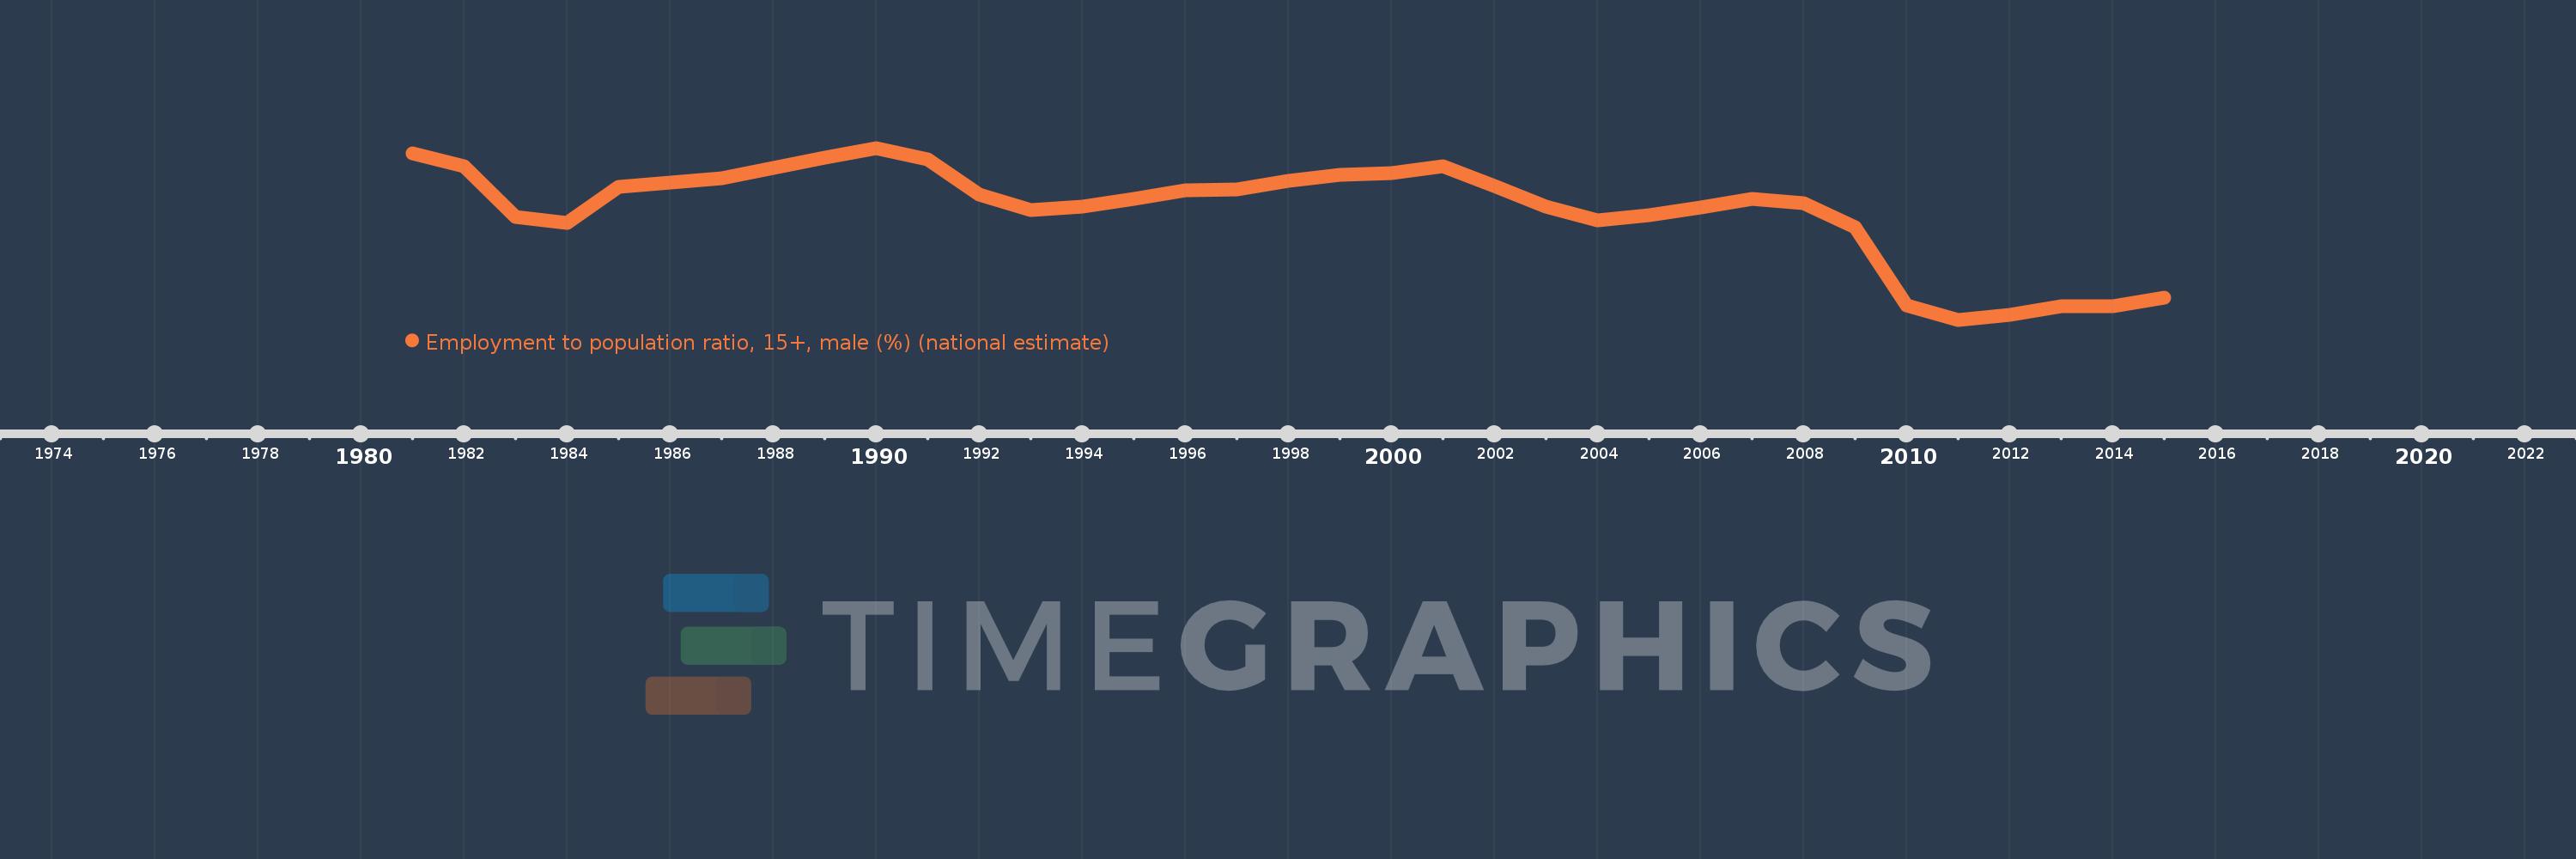
Employment to population ratio, 15+, male (%) (national estimate)
2015,2014,2013,2012,2011,2010,2009,2008,2007,2006,2005,2004,2003,2002,2001,2000,1999,1998,1997,1996,1995,1994,1993,1992,1991,1990,1989,1988,1987,1986,1985,1984,1983,1982,1981
This statistics in other country:
AfghanistanAlbaniaAlgeriaAmerican SamoaAntigua and BarbudaArab WorldArgentinaArmeniaArubaAustraliaAustriaAzerbaijanBahamas, TheBahrainBangladeshBarbadosBelarusBelgiumBelizeBeninBermudaBhutanBoliviaBosnia and HerzegovinaBotswanaBrazilBritish Virgin IslandsBrunei DarussalamBulgariaBurkina FasoBurundiCambodiaCameroonCanadaCaribbean small statesCayman IslandsCentral Europe and the BalticsChadChileColombiaCongo, Dem. Rep.Congo, Rep.Costa RicaCroatiaCubaCyprusCzech RepublicDenmarkDjiboutiDominicaDominican RepublicEarly-demographic dividendEcuadorEgypt, Arab Rep.El SalvadorEstoniaEthiopiaEuro areaEurope & Central AsiaEurope & Central Asia (excluding high income)Europe & Central Asia (IDA & IBRD countries)European UnionFaroe IslandsFijiFinlandFranceFrench PolynesiaGabonGambia, TheGeorgiaGermanyGhanaGreeceGrenadaGuamGuatemalaGuineaGuyanaHaitiHigh incomeHondurasHong Kong SAR, ChinaHungaryIcelandIndiaIndonesiaIran, Islamic Rep.IraqIrelandIsle of ManIsraelItalyJamaicaJapanJordanKazakhstanKenyaKiribatiKorea, Rep.KosovoKuwaitKyrgyz RepublicLao PDRLatin America & Caribbean Latin America & Caribbean (excluding high income)Latin America & the Caribbean (IDA & IBRD countries)LatviaLebanonLesothoLiberiaLibyaLithuaniaLower middle incomeLuxembourgMacao SAR, ChinaMacedonia, FYRMadagascarMalawiMalaysiaMaldivesMaliMaltaMarshall IslandsMauritaniaMauritiusMexicoMiddle East & North AfricaMiddle East & North Africa (excluding high income)Middle East & North Africa (IDA & IBRD countries)MoldovaMonacoMongoliaMontenegroMoroccoMozambiqueNamibiaNepalNetherlandsNew CaledoniaNew ZealandNicaraguaNigerNigeriaNorth AmericaNorthern Mariana IslandsNorwayOECD membersOmanPakistanPanamaParaguayPeruPhilippinesPolandPortugalPost-demographic dividendPuerto RicoQatarRomaniaRussian FederationRwandaSamoaSan MarinoSao Tome and PrincipeSaudi ArabiaSenegalSerbiaSeychellesSierra LeoneSingaporeSlovak RepublicSloveniaSolomon IslandsSouth AfricaSouth AsiaSouth Asia (IDA & IBRD)South SudanSpainSri LankaSt. Kitts and NevisSt. LuciaSudanSurinameSwazilandSwedenSwitzerlandSyrian Arab RepublicTajikistanTanzaniaThailandTimor-LesteTogoTongaTrinidad and TobagoTunisiaTurkeyTuvaluUgandaUkraineUnited Arab EmiratesUnited KingdomUnited StatesUruguayVanuatuVenezuela, RBVietnamWest Bank and GazaYemen, Rep.ZambiaZimbabwe Timeline:
This timeline shows a graph from 1981 to 2015 of North America. No data until 1980. Number of actual observations by date: 35.
Source name:
World Development Indicators
Source organization:
International Labour Organization, Key Indicators of the Labour Market database.
Categories, topics:
Social Protection & Labor
Last updated:
apr 23, 2017
Indicators value changes by year
Minimum:
63.865
jan 1, 2011
Maximum:
72.357
jan 1, 1990
At the date of observation
Value
Absolute change
Change from previous value
jan 1, 1981
72.08
+72.08
0.0%
jan 1, 1982
71.45
-0.63
-0.87%
jan 1, 1983
68.94
-2.51
-3.51%
jan 1, 1984
68.66
-0.28
-0.41%
jan 1, 1985
70.429
+1.77
2.58%
jan 1, 1986
70.659
+0.23
0.33%
jan 1, 1987
70.849
+0.19
0.27%
jan 1, 1988
71.379
+0.53
0.75%
jan 1, 1989
71.889
+0.51
0.71%
jan 1, 1990
72.357
+0.468
0.65%
jan 1, 1991
71.785
-0.572
-0.79%
jan 1, 1992
70.041
-1.744
-2.43%
jan 1, 1993
69.308
-0.733
-1.05%
jan 1, 1994
69.448
+0.14
0.2%
jan 1, 1995
69.86
+0.412
0.59%
jan 1, 1996
70.251
+0.392
0.56%
jan 1, 1997
70.3
+0.049
0.07%
jan 1, 1998
70.711
+0.41
0.58%
jan 1, 1999
71.032
+0.321
0.45%
jan 1, 2000
71.104
+0.072
0.1%
jan 1, 2001
71.434
+0.331
0.47%
jan 1, 2002
70.484
-0.95
-1.33%
jan 1, 2003
69.436
-1.048
-1.49%
jan 1, 2004
68.768
-0.668
-0.96%
jan 1, 2005
69.047
+0.279
0.41%
jan 1, 2006
69.406
+0.359
0.52%
jan 1, 2007
69.845
+0.439
0.63%
jan 1, 2008
69.606
-0.239
-0.34%
jan 1, 2009
68.449
-1.157
-1.66%
jan 1, 2010
64.562
-3.887
-5.68%
jan 1, 2011
63.865
-0.697
-1.08%
jan 1, 2012
64.086
+0.221
0.35%
jan 1, 2013
64.514
+0.428
0.67%
jan 1, 2014
64.524
+0.011
0.02%
jan 1, 2015
64.952
+0.428
0.66%
Ranking of countries by current statistics by years


Comments: