29
/
en
AIzaSyAYiBZKx7MnpbEhh9jyipgxe19OcubqV5w
April 1, 2024
51188
Middle income
MIC
false
2
1
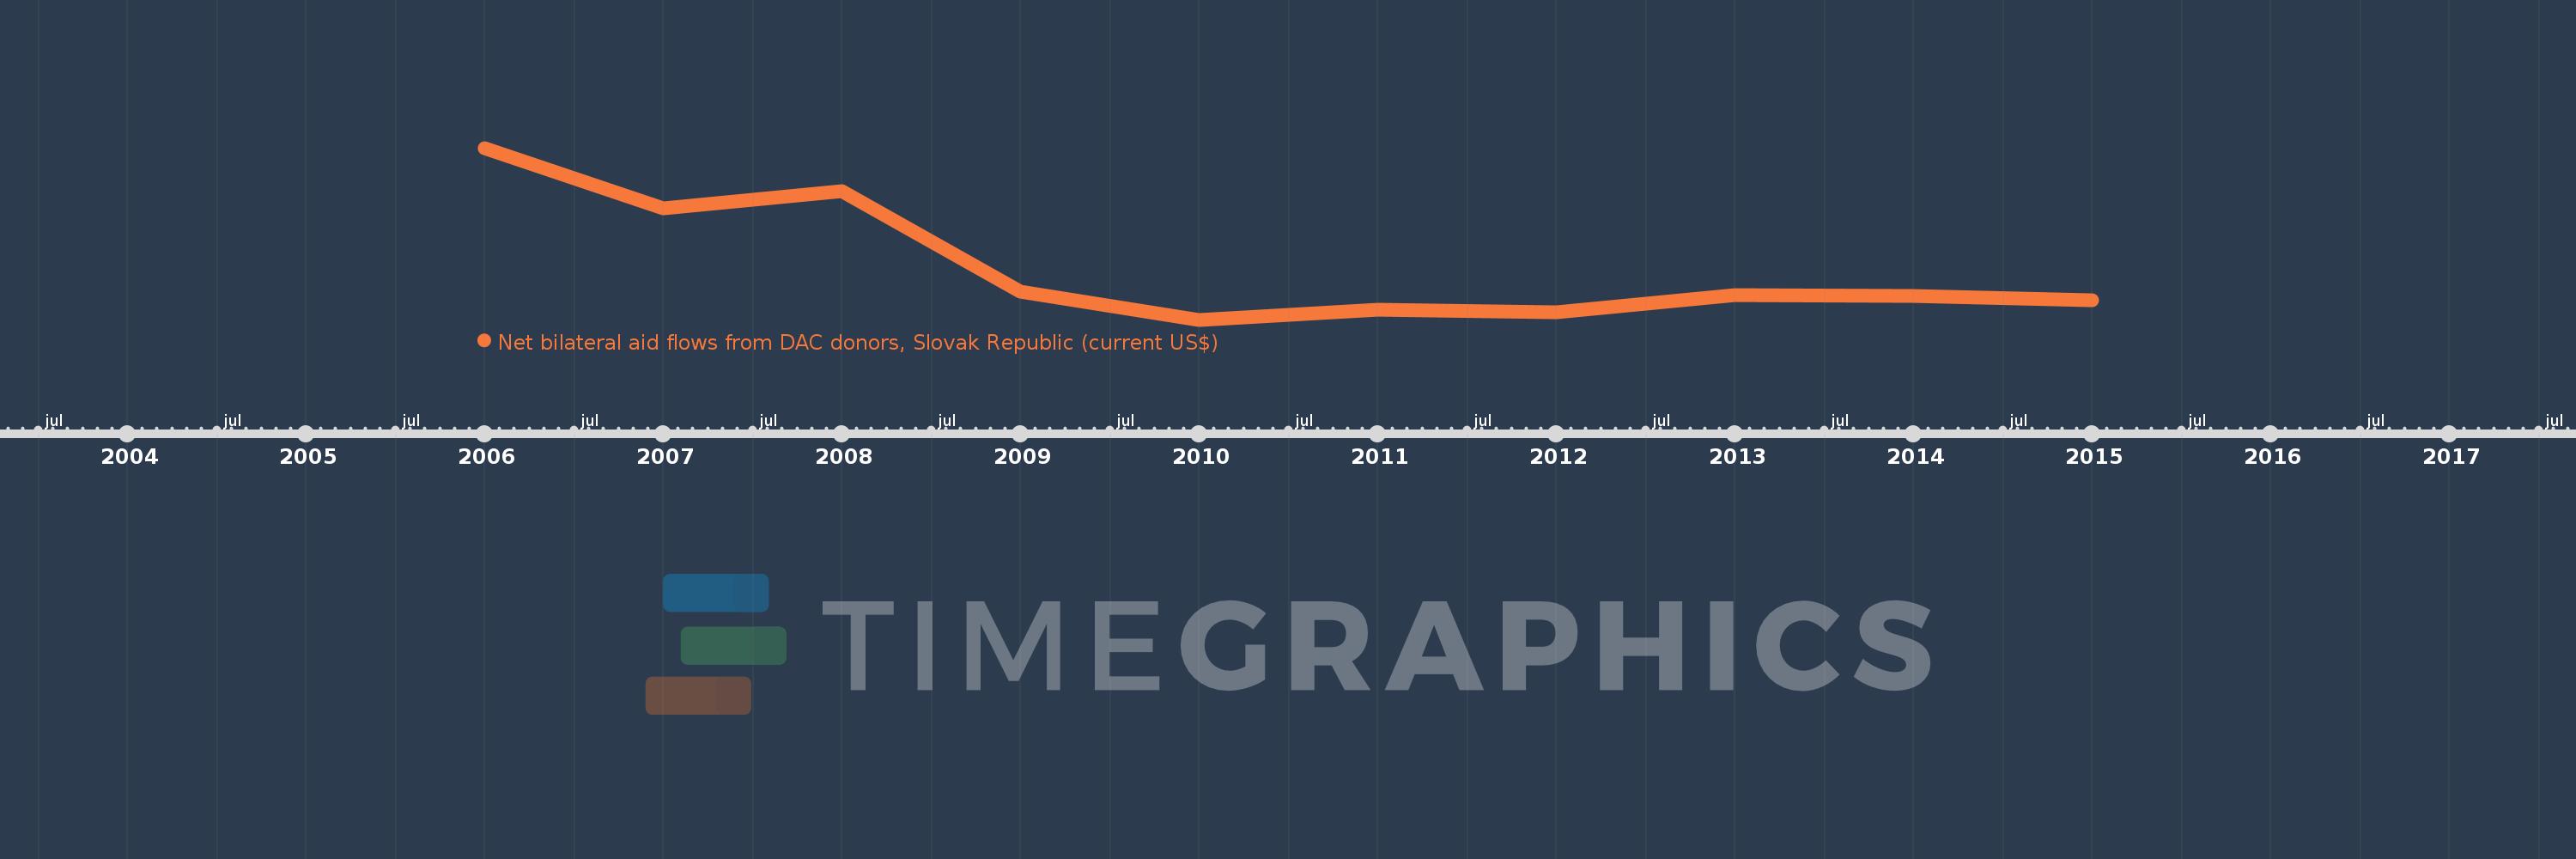
Net bilateral aid flows from DAC donors, Slovak Republic (current US$)
2015,2014,2013,2012,2011,2010,2009,2008,2007,2006
This statistics in other country:
Timeline:
This timeline shows a graph from 2006 to 2015 of Middle income. No data until 2005. Number of actual observations by date: 10.
Source name:
World Development Indicators
Source organization:
Development Assistance Committee of the Organisation for Economic Co-operation and Development, Geographical Distribution of Financial Flows to Developing Countries, Development Co-operation Report, and International Development Statistics database. Data are available online at: www.oecd.org/dac/stats/idsonline.
Categories, topics:
Aid Effectiveness
Last updated:
apr 23, 2017
Indicators value changes by year
Minimum:
5.11 mln
jan 1, 2010
Maximum:
26.87 mln
jan 1, 2006
At the date of observation
Value
Absolute change
Change from previous value
jan 1, 2006
26.87 mln
+26.87 mln
0.0%
jan 1, 2007
19.2 mln
-7.67 mln
-28.54%
jan 1, 2008
21.36 mln
+2.16 mln
11.25%
jan 1, 2009
8.7 mln
-12.66 mln
-59.27%
jan 1, 2010
5.11 mln
-3.59 mln
-41.26%
jan 1, 2011
6.43 mln
+1.32 mln
25.83%
jan 1, 2012
6.04 mln
-390.0K
-6.07%
jan 1, 2013
8.2 mln
+2.16 mln
35.76%
jan 1, 2014
8.09 mln
-110.0K
-1.34%
jan 1, 2015
7.6 mln
-490.0K
-6.06%
Ranking of countries by current statistics by years


Comments: