29
/
en
AIzaSyAYiBZKx7MnpbEhh9jyipgxe19OcubqV5w
April 1, 2024
50670
Middle income
MIC
false
2
1
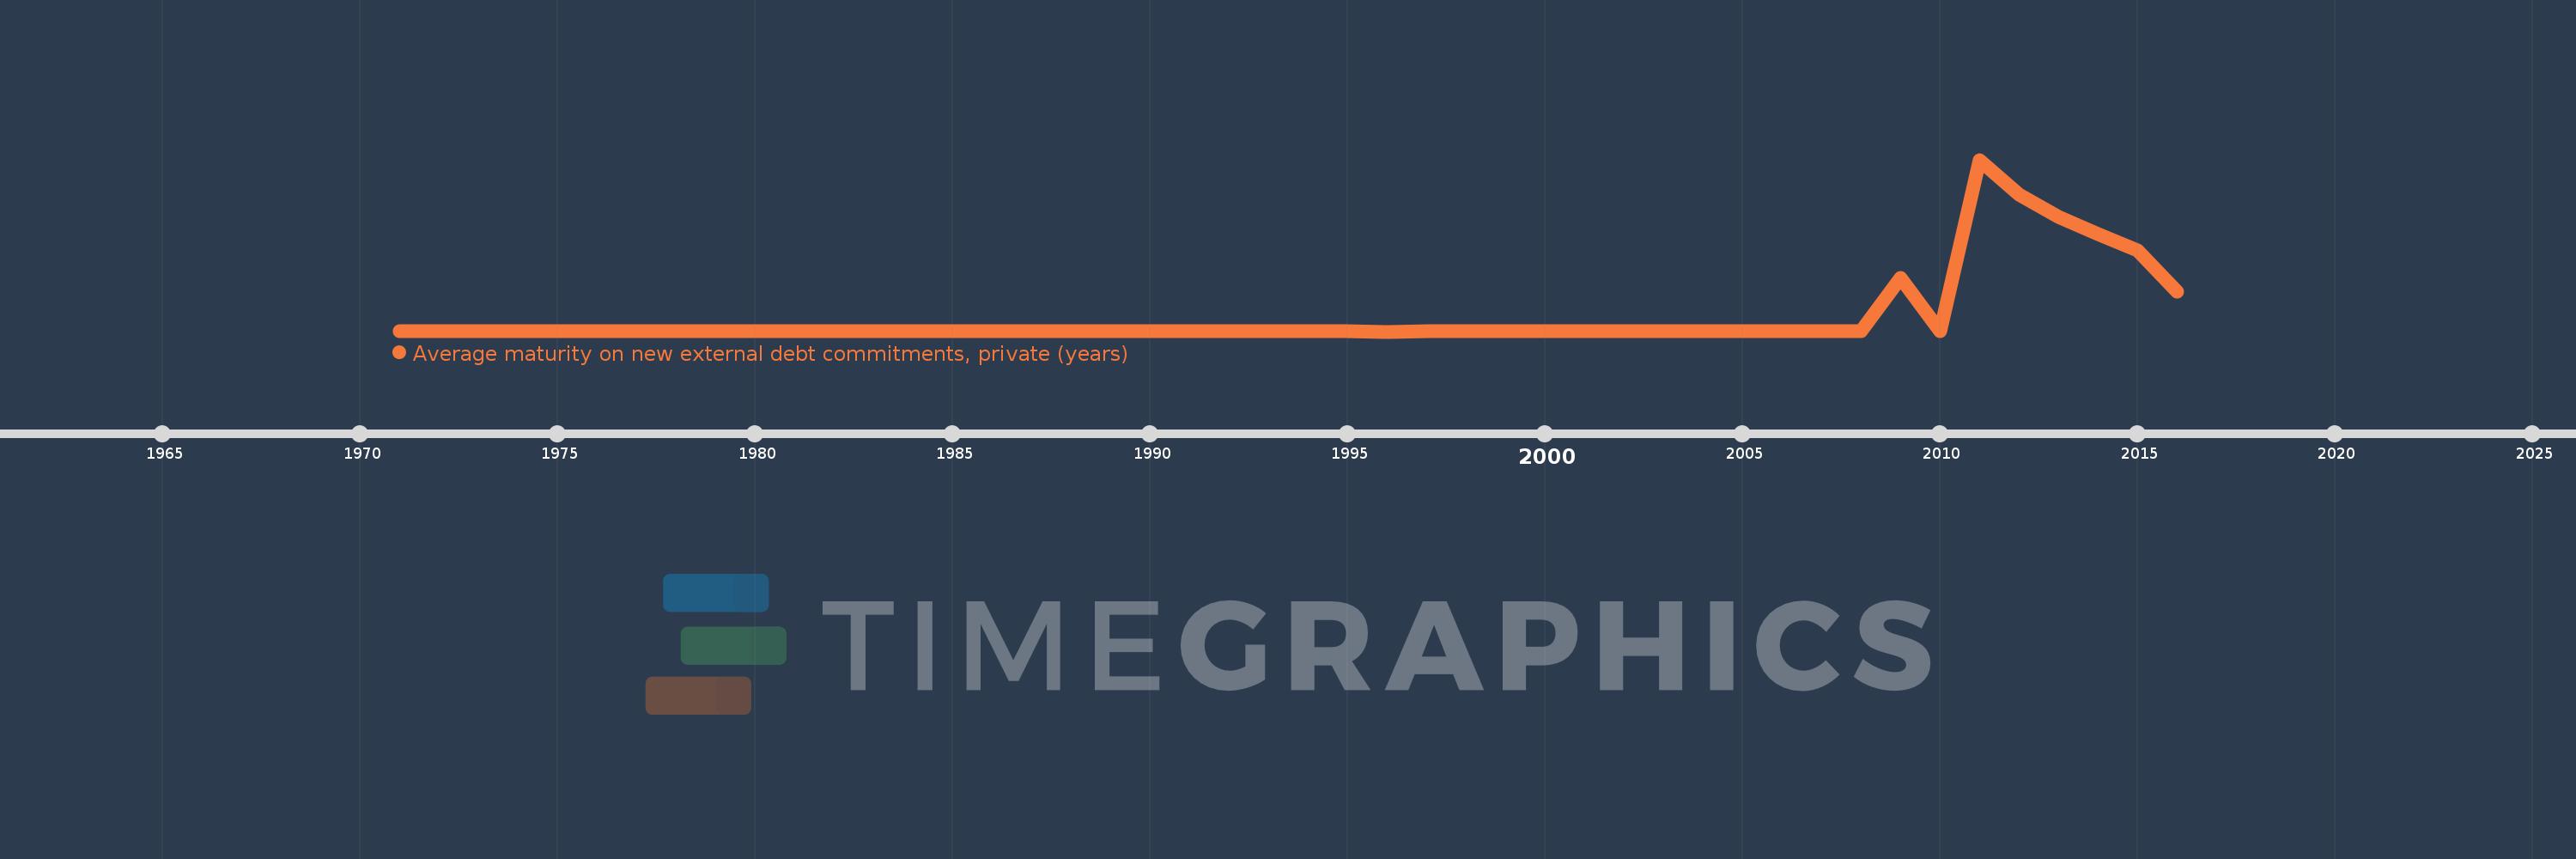
Average maturity on new external debt commitments, private (years)
2016,2015,2014,2013,2012,2011,2010,2009,2008,2007,2006,2005,2004,2003,2002,2001,2000,1999,1998,1997,1996,1995,1994,1993,1992,1991,1990,1989,1988,1987,1986,1985,1984,1983,1982,1981,1980,1979,1978,1977,1976,1975,1974,1973,1972,1971
This statistics in other country:
Timeline:
This timeline shows a graph from 1971 to 2016 of Middle income. No data until 1970. Number of actual observations by date: 46.
Source name:
World Development Indicators
Source organization:
World Bank, International Debt Statistics.
Categories, topics:
External Debt
Last updated:
apr 23, 2017
Indicators value changes by year
Maximum:
1.712K
jan 1, 2011
At the date of observation
Value
Absolute change
Change from previous value
jan 1, 1971
9.468
+9.468
0.0%
jan 1, 1972
8.868
-0.599
-6.33%
jan 1, 1973
8.932
+0.063
0.71%
jan 1, 1974
11.01
+2.079
23.27%
jan 1, 1975
11.024
+0.014
0.13%
jan 1, 1976
8.579
-2.445
-22.18%
jan 1, 1977
8.135
-0.445
-5.18%
jan 1, 1978
8.827
+0.693
8.52%
jan 1, 1979
9.491
+0.664
7.52%
jan 1, 1980
9.507
+0.016
0.17%
jan 1, 1981
9.579
+0.072
0.76%
jan 1, 1982
9.3
-0.279
-2.91%
jan 1, 1983
9.274
-0.026
-0.28%
jan 1, 1984
8.652
-0.622
-6.71%
jan 1, 1985
10.199
+1.547
17.89%
jan 1, 1986
10.555
+0.356
3.49%
jan 1, 1987
10.982
+0.427
4.04%
jan 1, 1988
10.535
-0.447
-4.07%
jan 1, 1989
10.133
-0.402
-3.81%
jan 1, 1990
10.605
+0.472
4.66%
jan 1, 1991
11.154
+0.549
5.18%
jan 1, 1992
10.541
-0.614
-5.5%
jan 1, 1993
10.535
-0.005
-0.05%
jan 1, 1994
9.887
-0.648
-6.15%
jan 1, 1995
9.252
-0.635
-6.42%
jan 1, 1996
7.491
-1.761
-19.04%
jan 1, 1997
7.947
+0.456
6.09%
jan 1, 1998
11.739
+3.792
47.72%
jan 1, 1999
10.189
-1.55
-13.21%
jan 1, 2000
9.706
-0.482
-4.73%
jan 1, 2001
11.527
+1.82
18.75%
jan 1, 2002
11.772
+0.246
2.13%
jan 1, 2003
11.163
-0.609
-5.17%
jan 1, 2004
12.347
+1.184
10.61%
jan 1, 2005
12.789
+0.442
3.58%
jan 1, 2006
13.233
+0.444
3.47%
jan 1, 2007
13.93
+0.696
5.26%
jan 1, 2008
13.723
-0.206
-1.48%
jan 1, 2009
539.471
+525.748
3.83K%
jan 1, 2010
14.144
-525.327
-97.38%
jan 1, 2011
1.712K
+1.697K
12.0K%
jan 1, 2012
1.367K
-344.805
-20.15%
jan 1, 2013
1.142K
-224.949
-16.46%
jan 1, 2014
978.334
-163.519
-14.32%
jan 1, 2015
809.937
-168.396
-17.21%
jan 1, 2016
401.605
-408.332
-50.42%
Ranking of countries by current statistics by years


Comments: