29
/
en
AIzaSyAYiBZKx7MnpbEhh9jyipgxe19OcubqV5w
April 1, 2024
50467
Middle East & North Africa (IDA & IBRD countries)
TMN
false
2
1
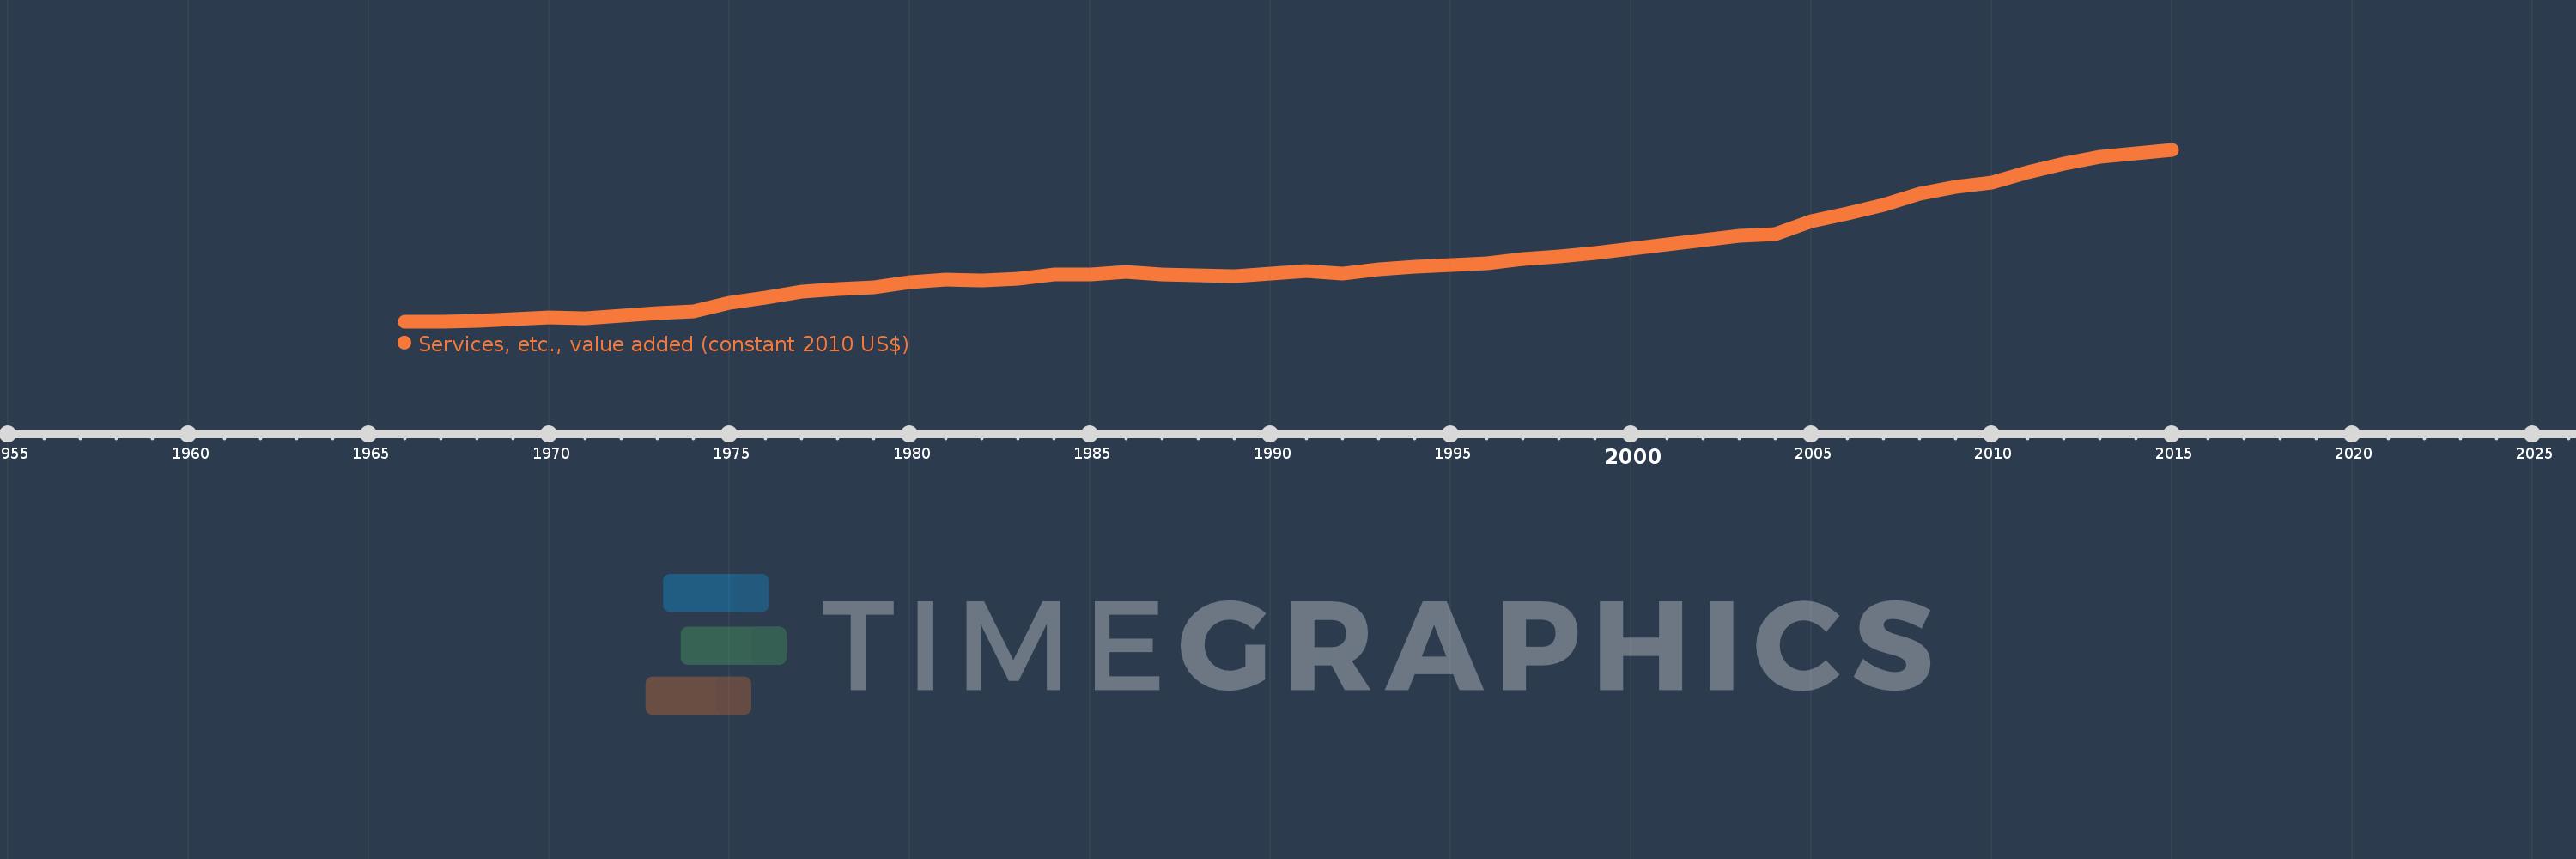
Services, etc., value added (constant 2010 US$)
2015,2014,2013,2012,2011,2010,2009,2008,2007,2006,2005,2004,2003,2002,2001,2000,1999,1998,1997,1996,1995,1994,1993,1992,1991,1990,1989,1988,1987,1986,1985,1984,1983,1982,1981,1980,1979,1978,1977,1976,1975,1974,1973,1972,1971,1970,1969,1968,1967,1966
This statistics in other country:
AfghanistanAlbaniaAlgeriaAndorraAntigua and BarbudaArab WorldArgentinaArmeniaArubaAustraliaAustriaAzerbaijanBahamas, TheBahrainBangladeshBarbadosBelarusBelgiumBelizeBeninBermudaBhutanBoliviaBosnia and HerzegovinaBotswanaBrazilBrunei DarussalamBulgariaBurkina FasoBurundiCabo VerdeCambodiaCameroonCanadaCaribbean small statesCentral African RepublicCentral Europe and the BalticsChadChileChinaColombiaComorosCongo, Dem. Rep.Congo, Rep.Costa RicaCote d'IvoireCroatiaCubaCyprusCzech RepublicDenmarkDominicaDominican RepublicEarly-demographic dividendEast Asia & PacificEast Asia & Pacific (excluding high income)East Asia & Pacific (IDA & IBRD countries)EcuadorEgypt, Arab Rep.El SalvadorEquatorial GuineaEstoniaEthiopiaEuro areaEurope & Central AsiaEurope & Central Asia (excluding high income)Europe & Central Asia (IDA & IBRD countries)European UnionFaroe IslandsFijiFinlandFragile and conflict affected situationsFranceGabonGambia, TheGeorgiaGermanyGhanaGreeceGrenadaGuatemalaGuineaGuinea-BissauGuyanaHeavily indebted poor countries (HIPC)High incomeHondurasHong Kong SAR, ChinaHungaryIBRD onlyIcelandIDA & IBRD totalIDA blendIDA onlyIDA totalIndiaIndonesiaIran, Islamic Rep.IraqIrelandItalyJamaicaJapanJordanKazakhstanKenyaKiribatiKorea, Rep.KosovoKuwaitKyrgyz RepublicLao PDRLate-demographic dividendLatin America & Caribbean Latin America & Caribbean (excluding high income)Latin America & the Caribbean (IDA & IBRD countries)LatviaLeast developed countries: UN classificationLebanonLesothoLiberiaLithuaniaLow & middle incomeLow incomeLower middle incomeLuxembourgMacao SAR, ChinaMacedonia, FYRMadagascarMalawiMalaysiaMaldivesMaliMaltaMarshall IslandsMauritaniaMauritiusMexicoMicronesia, Fed. Sts.Middle East & North AfricaMiddle East & North Africa (excluding high income)Middle East & North Africa (IDA & IBRD countries)Middle incomeMoldovaMongoliaMontenegroMoroccoMozambiqueMyanmarNamibiaNepalNetherlandsNew ZealandNicaraguaNigerNigeriaNorth AmericaNorwayOECD membersOmanOther small statesPacific island small statesPakistanPalauPanamaParaguayPeruPhilippinesPolandPortugalPost-demographic dividendPre-demographic dividendPuerto RicoQatarRomaniaRussian FederationRwandaSamoaSao Tome and PrincipeSaudi ArabiaSenegalSerbiaSeychellesSierra LeoneSingaporeSlovak RepublicSloveniaSmall statesSouth AfricaSouth AsiaSouth Asia (IDA & IBRD)SpainSri LankaSt. Kitts and NevisSt. LuciaSt. Vincent and the GrenadinesSub-Saharan Africa Sub-Saharan Africa (excluding high income)Sub-Saharan Africa (IDA & IBRD countries)SudanSurinameSwazilandSwedenSwitzerlandTajikistanTanzaniaThailandTimor-LesteTogoTongaTrinidad and TobagoTunisiaTurkeyTurkmenistanTuvaluUgandaUkraineUnited Arab EmiratesUnited KingdomUnited StatesUpper middle incomeUruguayUzbekistanVanuatuVenezuela, RBVietnamWest Bank and GazaWorldYemen, Rep.ZambiaZimbabwe Timeline:
This timeline shows a graph from 1966 to 2015 of Middle East & North Africa (IDA & IBRD countries). No data until 1965. Number of actual observations by date: 50.
Source name:
World Development Indicators
Source organization:
World Bank national accounts data, and OECD National Accounts data files.
Categories, topics:
Economy & Growth
Last updated:
apr 23, 2017
Indicators value changes by year
Minimum:
64.549 bln
jan 1, 1966
Maximum:
721.859 bln
jan 1, 2015
At the date of observation
Value
Absolute change
Change from previous value
jan 1, 1966
64.549 bln
+64.549 bln
0.0%
jan 1, 1967
64.904 bln
+355.452 mln
0.55%
jan 1, 1968
68.735 bln
+3.831 bln
5.9%
jan 1, 1969
73.943 bln
+5.208 bln
7.58%
jan 1, 1970
81.262 bln
+7.319 bln
9.9%
jan 1, 1971
80.188 bln
-1.074 bln
-1.32%
jan 1, 1972
88.835 bln
+8.647 bln
10.78%
jan 1, 1973
99.751 bln
+10.915 bln
12.29%
jan 1, 1974
103.477 bln
+3.726 bln
3.74%
jan 1, 1975
136.542 bln
+33.065 bln
31.95%
jan 1, 1976
159.048 bln
+22.506 bln
16.48%
jan 1, 1977
180.629 bln
+21.581 bln
13.57%
jan 1, 1978
191.985 bln
+11.355 bln
6.29%
jan 1, 1979
197.534 bln
+5.55 bln
2.89%
jan 1, 1980
216.539 bln
+19.005 bln
9.62%
jan 1, 1981
226.602 bln
+10.063 bln
4.65%
jan 1, 1982
224.845 bln
-1.757 bln
-0.78%
jan 1, 1983
231.237 bln
+6.392 bln
2.84%
jan 1, 1984
244.786 bln
+13.549 bln
5.86%
jan 1, 1985
247.676 bln
+2.889 bln
1.18%
jan 1, 1986
255.777 bln
+8.101 bln
3.27%
jan 1, 1987
244.797 bln
-10.98 bln
-4.29%
jan 1, 1988
243.028 bln
-1.769 bln
-0.72%
jan 1, 1989
239.191 bln
-3.837 bln
-1.58%
jan 1, 1990
249.939 bln
+10.748 bln
4.49%
jan 1, 1991
258.266 bln
+8.327 bln
3.33%
jan 1, 1992
250.965 bln
-7.301 bln
-2.83%
jan 1, 1993
266.29 bln
+15.325 bln
6.11%
jan 1, 1994
276.323 bln
+10.033 bln
3.77%
jan 1, 1995
280.881 bln
+4.559 bln
1.65%
jan 1, 1996
289.485 bln
+8.603 bln
3.06%
jan 1, 1997
306.124 bln
+16.639 bln
5.75%
jan 1, 1998
314.554 bln
+8.43 bln
2.75%
jan 1, 1999
327.801 bln
+13.247 bln
4.21%
jan 1, 2000
346.156 bln
+18.355 bln
5.6%
jan 1, 2001
362.925 bln
+16.769 bln
4.84%
jan 1, 2002
378.95 bln
+16.025 bln
4.42%
jan 1, 2003
394.632 bln
+15.682 bln
4.14%
jan 1, 2004
402.29 bln
+7.658 bln
1.94%
jan 1, 2005
448.797 bln
+46.508 bln
11.56%
jan 1, 2006
479.213 bln
+30.415 bln
6.78%
jan 1, 2007
512.122 bln
+32.909 bln
6.87%
jan 1, 2008
554.001 bln
+41.88 bln
8.18%
jan 1, 2009
580.349 bln
+26.348 bln
4.76%
jan 1, 2010
598.99 bln
+18.641 bln
3.21%
jan 1, 2011
638.075 bln
+39.085 bln
6.53%
jan 1, 2012
671.663 bln
+33.588 bln
5.26%
jan 1, 2013
697.632 bln
+25.969 bln
3.87%
jan 1, 2014
708.845 bln
+11.214 bln
1.61%
jan 1, 2015
721.859 bln
+13.013 bln
1.84%
Ranking of countries by current statistics by years


Comments: