29
/
en
AIzaSyAYiBZKx7MnpbEhh9jyipgxe19OcubqV5w
April 1, 2024
49757
Middle East & North Africa (IDA & IBRD countries)
TMN
false
2
1
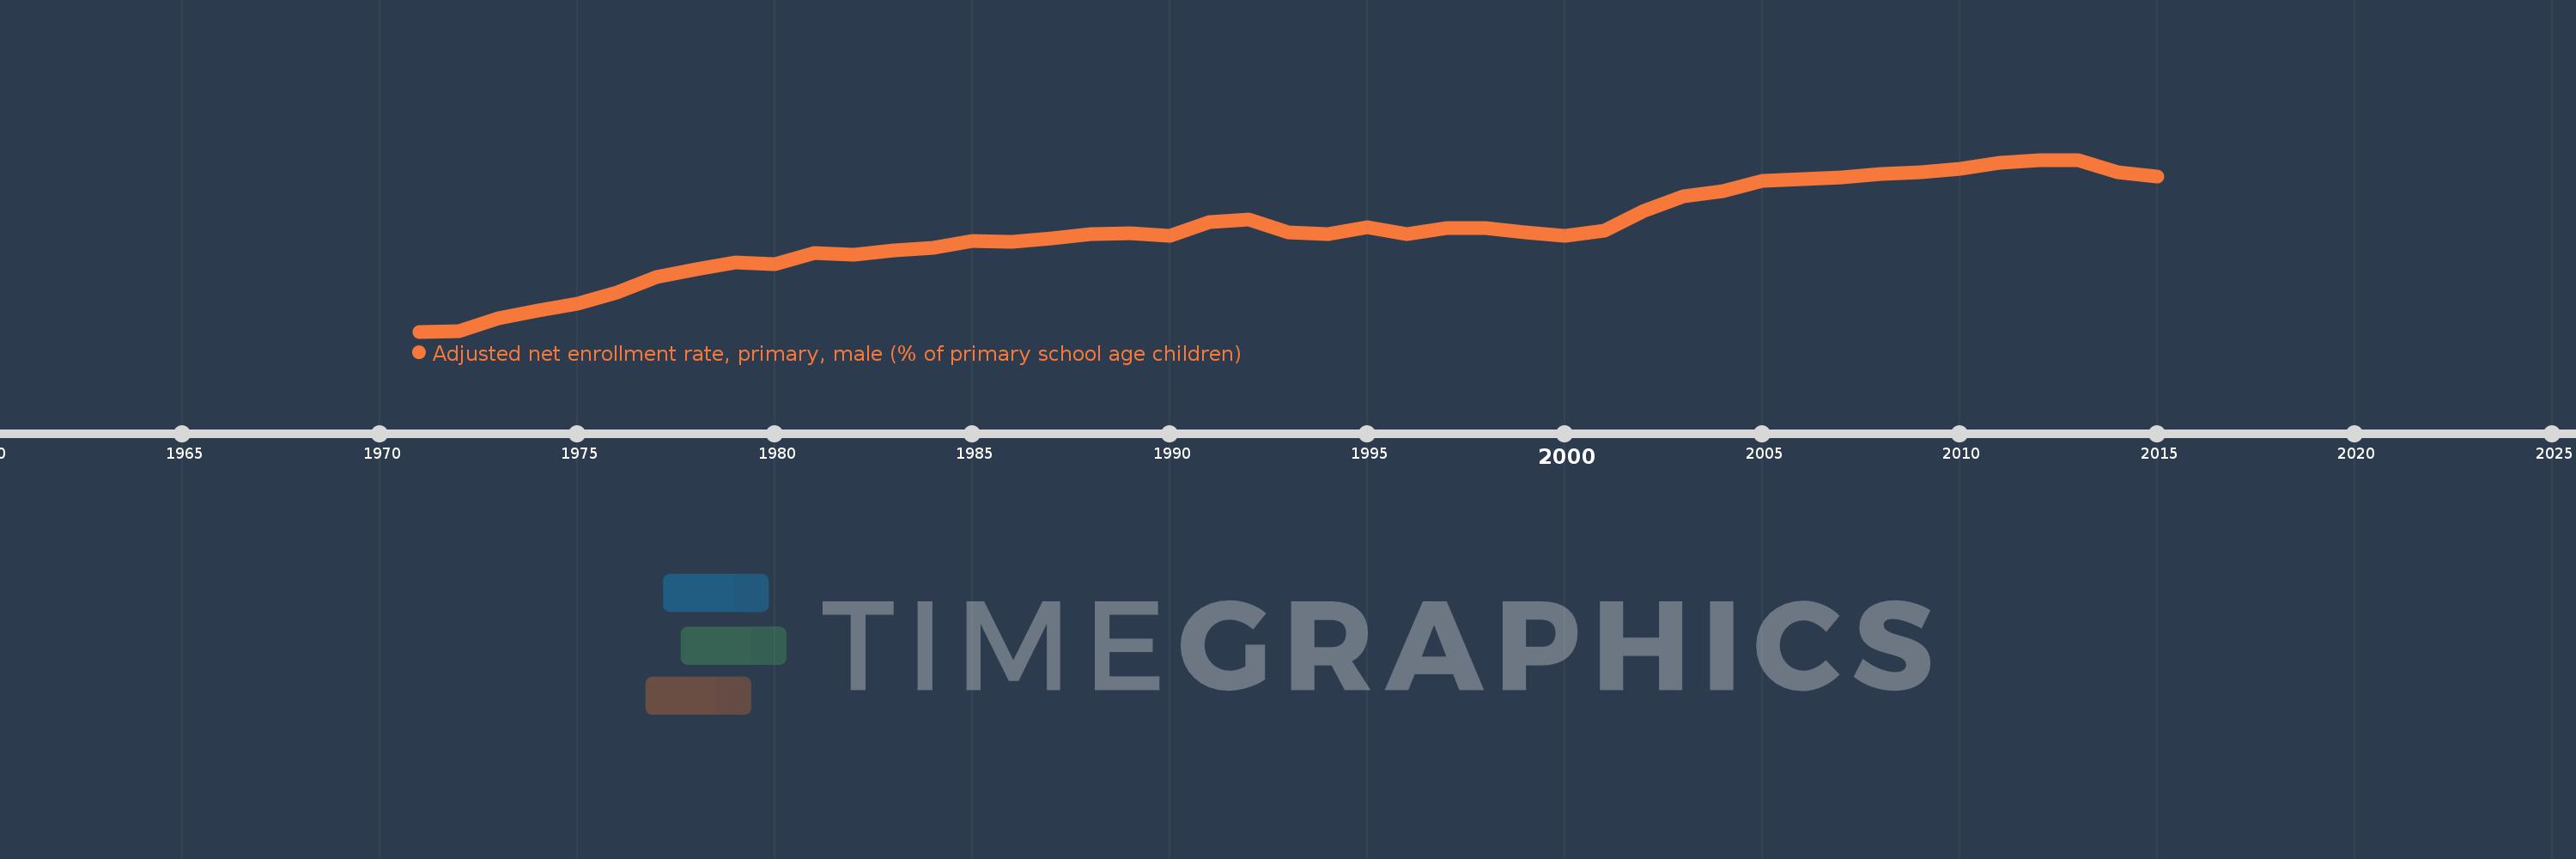
Adjusted net enrollment rate, primary, male (% of primary school age children)
2015,2014,2013,2012,2011,2010,2009,2008,2007,2006,2005,2004,2003,2002,2001,2000,1999,1998,1997,1996,1995,1994,1993,1992,1991,1990,1989,1988,1987,1986,1985,1984,1983,1982,1981,1980,1979,1978,1977,1976,1975,1974,1973,1972,1971
This statistics in other country:
AfghanistanAlbaniaAlgeriaAngolaAntigua and BarbudaArab WorldArgentinaArmeniaArubaAustraliaAustriaAzerbaijanBahamas, TheBahrainBangladeshBarbadosBelarusBelgiumBelizeBeninBermudaBhutanBoliviaBosnia and HerzegovinaBotswanaBrazilBrunei DarussalamBulgariaBurkina FasoBurundiCabo VerdeCambodiaCameroonCanadaCaribbean small statesCentral African RepublicCentral Europe and the BalticsChadChileChinaColombiaComorosCongo, Dem. Rep.Congo, Rep.Costa RicaCote d'IvoireCroatiaCubaCyprusDenmarkDjiboutiDominicaDominican RepublicEarly-demographic dividendEast Asia & PacificEast Asia & Pacific (excluding high income)East Asia & Pacific (IDA & IBRD countries)EcuadorEgypt, Arab Rep.El SalvadorEquatorial GuineaEritreaEstoniaEthiopiaEuro areaEurope & Central AsiaEurope & Central Asia (excluding high income)Europe & Central Asia (IDA & IBRD countries)European UnionFijiFinlandFragile and conflict affected situationsFranceGabonGambia, TheGeorgiaGhanaGreeceGrenadaGuatemalaGuineaGuinea-BissauGuyanaHaitiHeavily indebted poor countries (HIPC)High incomeHondurasHong Kong SAR, ChinaHungaryIBRD onlyIcelandIDA & IBRD totalIDA blendIDA onlyIDA totalIndiaIndonesiaIran, Islamic Rep.IraqIrelandIsraelItalyJamaicaJapanJordanKazakhstanKenyaKiribatiKorea, Dem. People’s Rep.Korea, Rep.KuwaitKyrgyz RepublicLao PDRLate-demographic dividendLatin America & Caribbean Latin America & Caribbean (excluding high income)Latin America & the Caribbean (IDA & IBRD countries)LatviaLeast developed countries: UN classificationLebanonLesothoLiberiaLibyaLiechtensteinLithuaniaLow & middle incomeLow incomeLower middle incomeLuxembourgMacao SAR, ChinaMacedonia, FYRMadagascarMalawiMaldivesMaliMaltaMarshall IslandsMauritaniaMauritiusMexicoMicronesia, Fed. Sts.Middle East & North AfricaMiddle East & North Africa (excluding high income)Middle East & North Africa (IDA & IBRD countries)Middle incomeMoldovaMongoliaMontenegroMoroccoMozambiqueMyanmarNamibiaNauruNepalNetherlandsNew ZealandNicaraguaNigerNigeriaNorth AmericaNorwayOECD membersOmanOther small statesPacific island small statesPakistanPanamaPapua New GuineaParaguayPeruPhilippinesPolandPortugalPost-demographic dividendPre-demographic dividendPuerto RicoQatarRomaniaRussian FederationRwandaSamoaSan MarinoSao Tome and PrincipeSaudi ArabiaSenegalSerbiaSeychellesSierra LeoneSloveniaSmall statesSolomon IslandsSomaliaSouth AfricaSouth AsiaSouth Asia (IDA & IBRD)South SudanSpainSri LankaSt. Kitts and NevisSt. LuciaSt. Vincent and the GrenadinesSub-Saharan Africa Sub-Saharan Africa (excluding high income)Sub-Saharan Africa (IDA & IBRD countries)SudanSurinameSwazilandSwedenSwitzerlandSyrian Arab RepublicTajikistanTanzaniaThailandTimor-LesteTogoTongaTrinidad and TobagoTunisiaTurkeyTuvaluUgandaUkraineUnited Arab EmiratesUnited KingdomUnited StatesUpper middle incomeUruguayUzbekistanVanuatuVenezuela, RBWest Bank and GazaWorldYemen, Rep.ZambiaZimbabwe Timeline:
This timeline shows a graph from 1971 to 2015 of Middle East & North Africa (IDA & IBRD countries). No data until 1970. Number of actual observations by date: 45.
Source name:
World Development Indicators
Source organization:
United Nations Educational, Scientific, and Cultural Organization (UNESCO) Institute for Statistics.
Categories, topics:
Education, Gender
Last updated:
apr 23, 2017
Indicators value changes by year
Minimum:
75.778
jan 1, 1971
Maximum:
97.887
jan 1, 2013
At the date of observation
Value
Absolute change
Change from previous value
jan 1, 1971
75.778
+75.778
0.0%
jan 1, 1972
75.801
+0.023
0.03%
jan 1, 1973
77.444
+1.643
2.17%
jan 1, 1974
78.469
+1.025
1.32%
jan 1, 1975
79.395
+0.926
1.18%
jan 1, 1976
80.764
+1.369
1.72%
jan 1, 1977
82.78
+2.016
2.5%
jan 1, 1978
83.827
+1.047
1.26%
jan 1, 1979
84.723
+0.897
1.07%
jan 1, 1980
84.493
-0.231
-0.27%
jan 1, 1981
85.908
+1.415
1.67%
jan 1, 1982
85.715
-0.193
-0.22%
jan 1, 1983
86.24
+0.525
0.61%
jan 1, 1984
86.541
+0.301
0.35%
jan 1, 1985
87.487
+0.945
1.09%
jan 1, 1986
87.34
-0.147
-0.17%
jan 1, 1987
87.722
+0.382
0.44%
jan 1, 1988
88.319
+0.597
0.68%
jan 1, 1989
88.405
+0.085
0.1%
jan 1, 1990
88.07
-0.334
-0.38%
jan 1, 1991
89.828
+1.758
2.0%
jan 1, 1992
90.22
+0.392
0.44%
jan 1, 1993
88.535
-1.685
-1.87%
jan 1, 1994
88.333
-0.203
-0.23%
jan 1, 1995
89.193
+0.86
0.97%
jan 1, 1996
88.279
-0.914
-1.03%
jan 1, 1997
89.119
+0.84
0.95%
jan 1, 1998
89.149
+0.03
0.03%
jan 1, 1999
88.575
-0.574
-0.64%
jan 1, 2000
88.131
-0.444
-0.5%
jan 1, 2001
88.762
+0.631
0.72%
jan 1, 2002
91.298
+2.536
2.86%
jan 1, 2003
93.239
+1.94
2.13%
jan 1, 2004
93.817
+0.578
0.62%
jan 1, 2005
95.137
+1.32
1.41%
jan 1, 2006
95.437
+0.3
0.32%
jan 1, 2007
95.607
+0.171
0.18%
jan 1, 2008
96.054
+0.447
0.47%
jan 1, 2009
96.309
+0.254
0.26%
jan 1, 2010
96.693
+0.384
0.4%
jan 1, 2011
97.472
+0.779
0.81%
jan 1, 2012
97.867
+0.394
0.4%
jan 1, 2013
97.887
+0.02
0.02%
jan 1, 2014
96.244
-1.643
-1.68%
jan 1, 2015
95.702
-0.542
-0.56%
Ranking of countries by current statistics by years


Comments: