29
/
en
AIzaSyAYiBZKx7MnpbEhh9jyipgxe19OcubqV5w
April 1, 2024
48864
Middle East & North Africa (excluding high income)
MNA
false
2
1
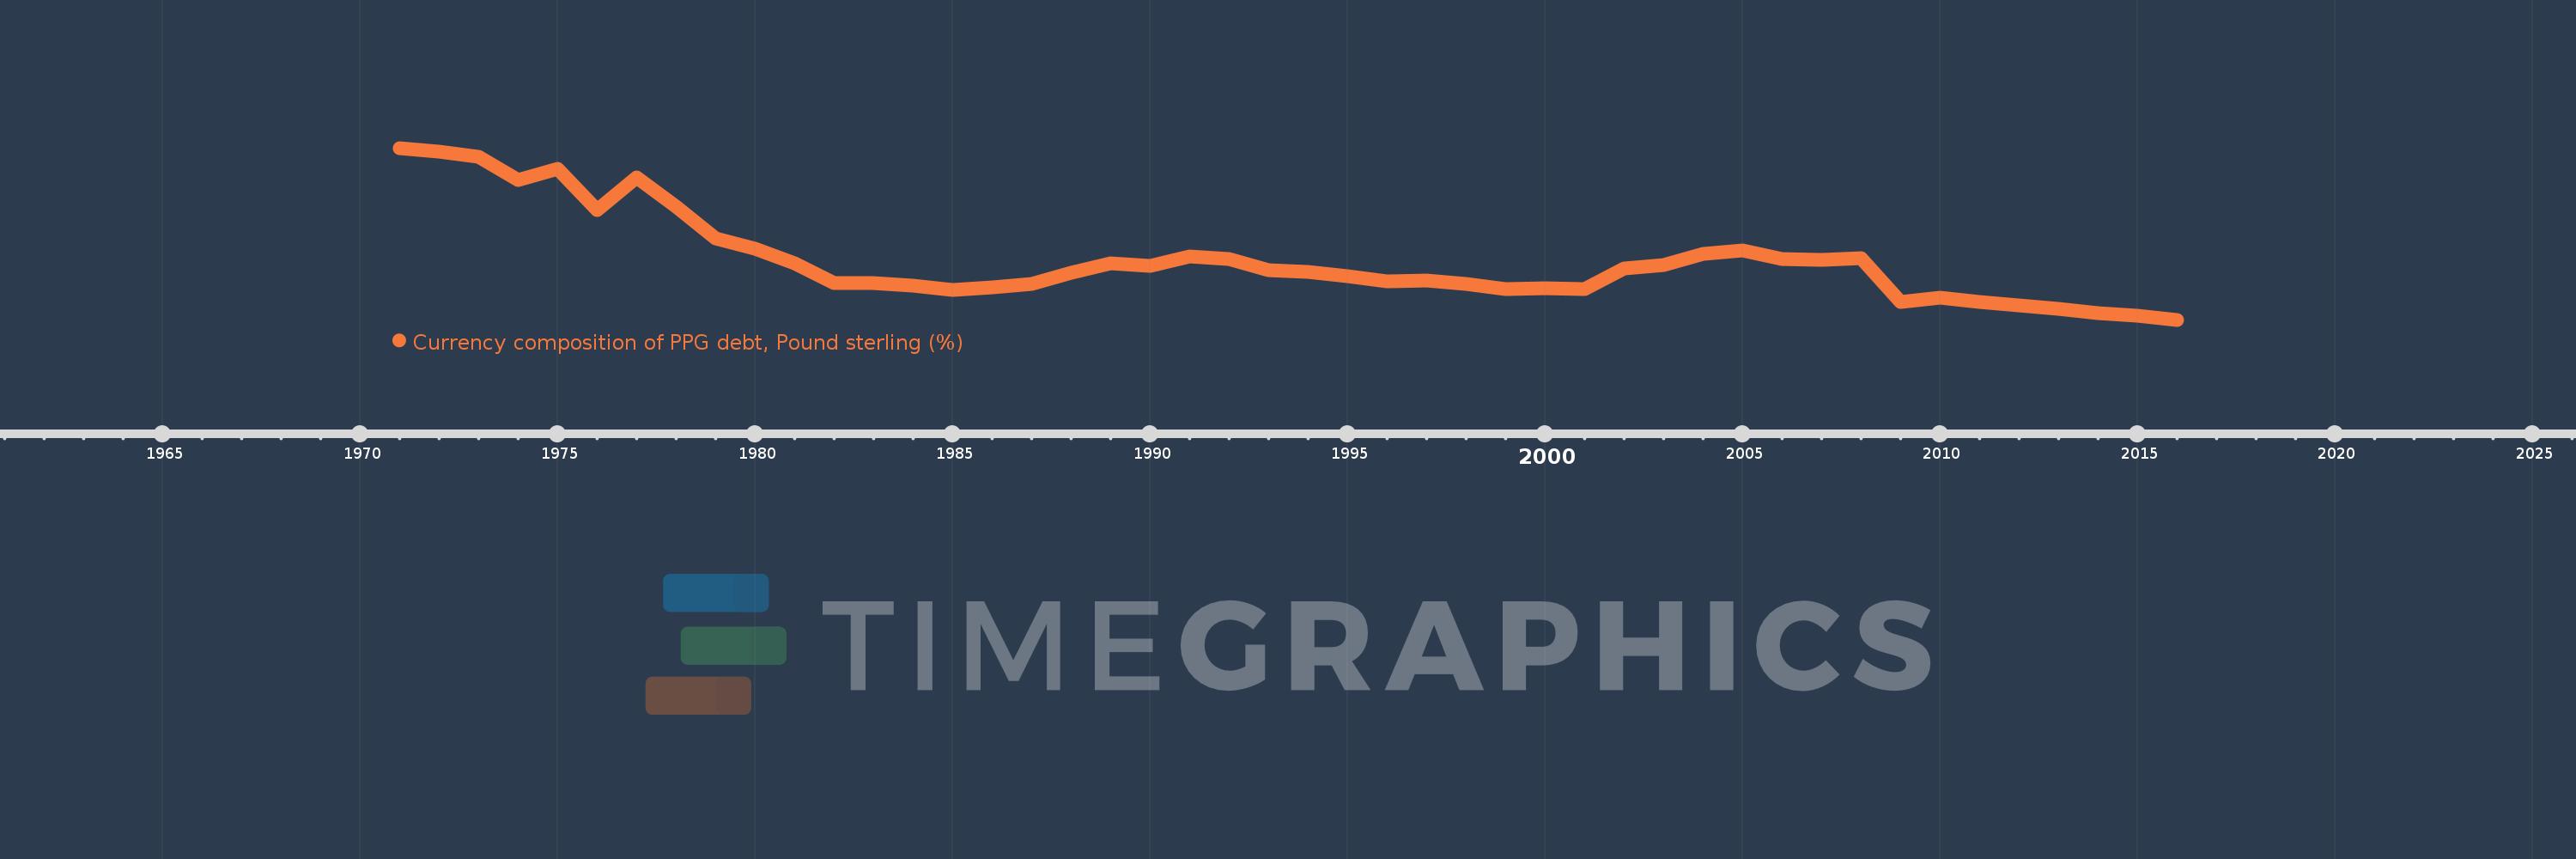
Currency composition of PPG debt, Pound sterling (%)
2016,2015,2014,2013,2012,2011,2010,2009,2008,2007,2006,2005,2004,2003,2002,2001,2000,1999,1998,1997,1996,1995,1994,1993,1992,1991,1990,1989,1988,1987,1986,1985,1984,1983,1982,1981,1980,1979,1978,1977,1976,1975,1974,1973,1972,1971
This statistics in other country:
Timeline:
This timeline shows a graph from 1971 to 2016 of Middle East & North Africa (excluding high income). No data until 1970. Number of actual observations by date: 46.
Source name:
World Development Indicators
Source organization:
World Bank, International Debt Statistics.
Categories, topics:
External Debt
Last updated:
apr 23, 2017
Indicators value changes by year
At the date of observation
Value
Absolute change
Change from previous value
jan 1, 1971
4.173
+4.173
0.0%
jan 1, 1972
4.082
-0.091
-2.17%
jan 1, 1973
3.956
-0.126
-3.1%
jan 1, 1974
3.414
-0.541
-13.68%
jan 1, 1975
3.674
+0.26
7.61%
jan 1, 1976
2.71
-0.964
-26.24%
jan 1, 1977
3.487
+0.777
28.68%
jan 1, 1978
2.786
-0.701
-20.11%
jan 1, 1979
2.036
-0.75
-26.92%
jan 1, 1980
1.787
-0.249
-12.21%
jan 1, 1981
1.459
-0.328
-18.37%
jan 1, 1982
0.99
-0.469
-32.12%
jan 1, 1983
0.983
-0.008
-0.78%
jan 1, 1984
0.933
-0.05
-5.07%
jan 1, 1985
0.83
-0.103
-11.0%
jan 1, 1986
0.883
+0.052
6.3%
jan 1, 1987
0.971
+0.089
10.06%
jan 1, 1988
1.22
+0.249
25.62%
jan 1, 1989
1.459
+0.238
19.54%
jan 1, 1990
1.384
-0.075
-5.12%
jan 1, 1991
1.616
+0.232
16.74%
jan 1, 1992
1.548
-0.068
-4.2%
jan 1, 1993
1.291
-0.257
-16.61%
jan 1, 1994
1.248
-0.042
-3.28%
jan 1, 1995
1.157
-0.091
-7.33%
jan 1, 1996
1.022
-0.135
-11.67%
jan 1, 1997
1.053
+0.031
3.0%
jan 1, 1998
0.967
-0.086
-8.14%
jan 1, 1999
0.849
-0.118
-12.23%
jan 1, 2000
0.872
+0.023
2.75%
jan 1, 2001
0.849
-0.023
-2.59%
jan 1, 2002
1.331
+0.482
56.75%
jan 1, 2003
1.406
+0.075
5.6%
jan 1, 2004
1.667
+0.261
18.54%
jan 1, 2005
1.758
+0.091
5.45%
jan 1, 2006
1.545
-0.213
-12.11%
jan 1, 2007
1.538
-0.007
-0.44%
jan 1, 2008
1.573
+0.035
2.29%
jan 1, 2009
0.532
-1.041
-66.16%
jan 1, 2010
0.632
+0.099
18.68%
jan 1, 2011
0.535
-0.097
-15.35%
jan 1, 2012
0.468
-0.067
-12.52%
jan 1, 2013
0.38
-0.088
-18.8%
jan 1, 2014
0.274
-0.106
-27.78%
jan 1, 2015
0.207
-0.067
-24.47%
jan 1, 2016
0.12
-0.087
-42.05%
Ranking of countries by current statistics by years


Comments: