29
/
en
AIzaSyAYiBZKx7MnpbEhh9jyipgxe19OcubqV5w
April 1, 2024
48761
Middle East & North Africa (excluding high income)
MNA
false
2
1
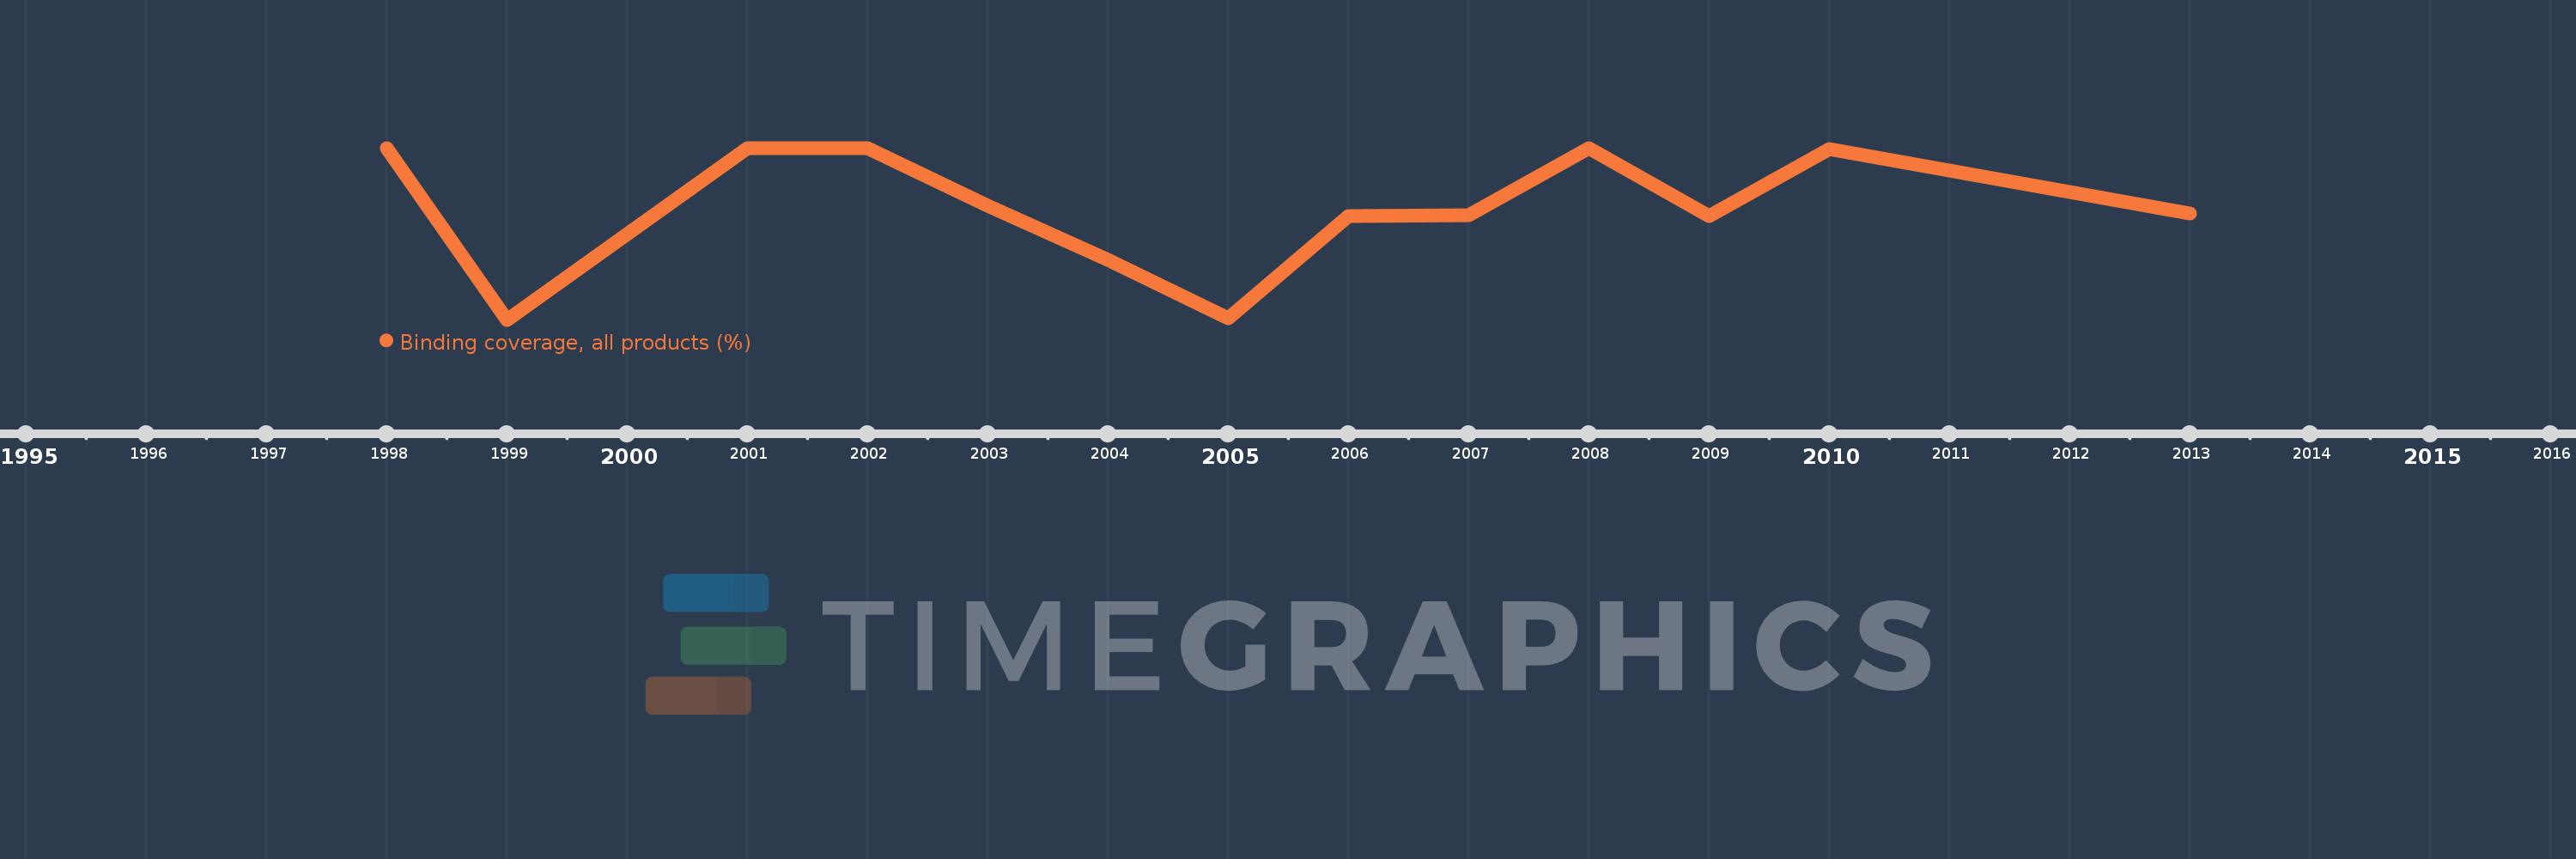
Binding coverage, all products (%)
2013,2010,2009,2008,2007,2006,2005,2004,2003,2002,2001,1999,1998
This statistics in other country:
Timeline:
This timeline shows a graph from 1998 to 2013 of Middle East & North Africa (excluding high income). No data until 1997. Number of actual observations by date: 13.
Source name:
World Development Indicators
Source organization:
World Bank staff estimates using the World Integrated Trade Solution system, based on data from World Trade Organization.
Categories, topics:
Private Sector, Trade
Last updated:
apr 23, 2017
Indicators value changes by year
At the date of observation
Value
Absolute change
Change from previous value
jan 1, 1998
100.0
+100.0
0.0%
jan 1, 1999
78.49
-21.51
-21.51%
jan 1, 2001
99.98
+21.49
27.38%
jan 1, 2002
99.98
0.0
0.0%
jan 1, 2003
92.81
-7.17
-7.17%
jan 1, 2004
85.98
-6.83
-7.36%
jan 1, 2005
78.65
-7.33
-8.53%
jan 1, 2006
91.45
+12.8
16.27%
jan 1, 2007
91.59
+0.14
0.15%
jan 1, 2008
99.99
+8.4
9.17%
jan 1, 2009
91.51
-8.48
-8.48%
jan 1, 2010
99.85
+8.34
9.11%
jan 1, 2013
91.84
-8.01
-8.02%
Ranking of countries by current statistics by years


Comments: