29
/
en
AIzaSyAYiBZKx7MnpbEhh9jyipgxe19OcubqV5w
April 1, 2024
48248
Middle East & North Africa
MEA
false
2
1
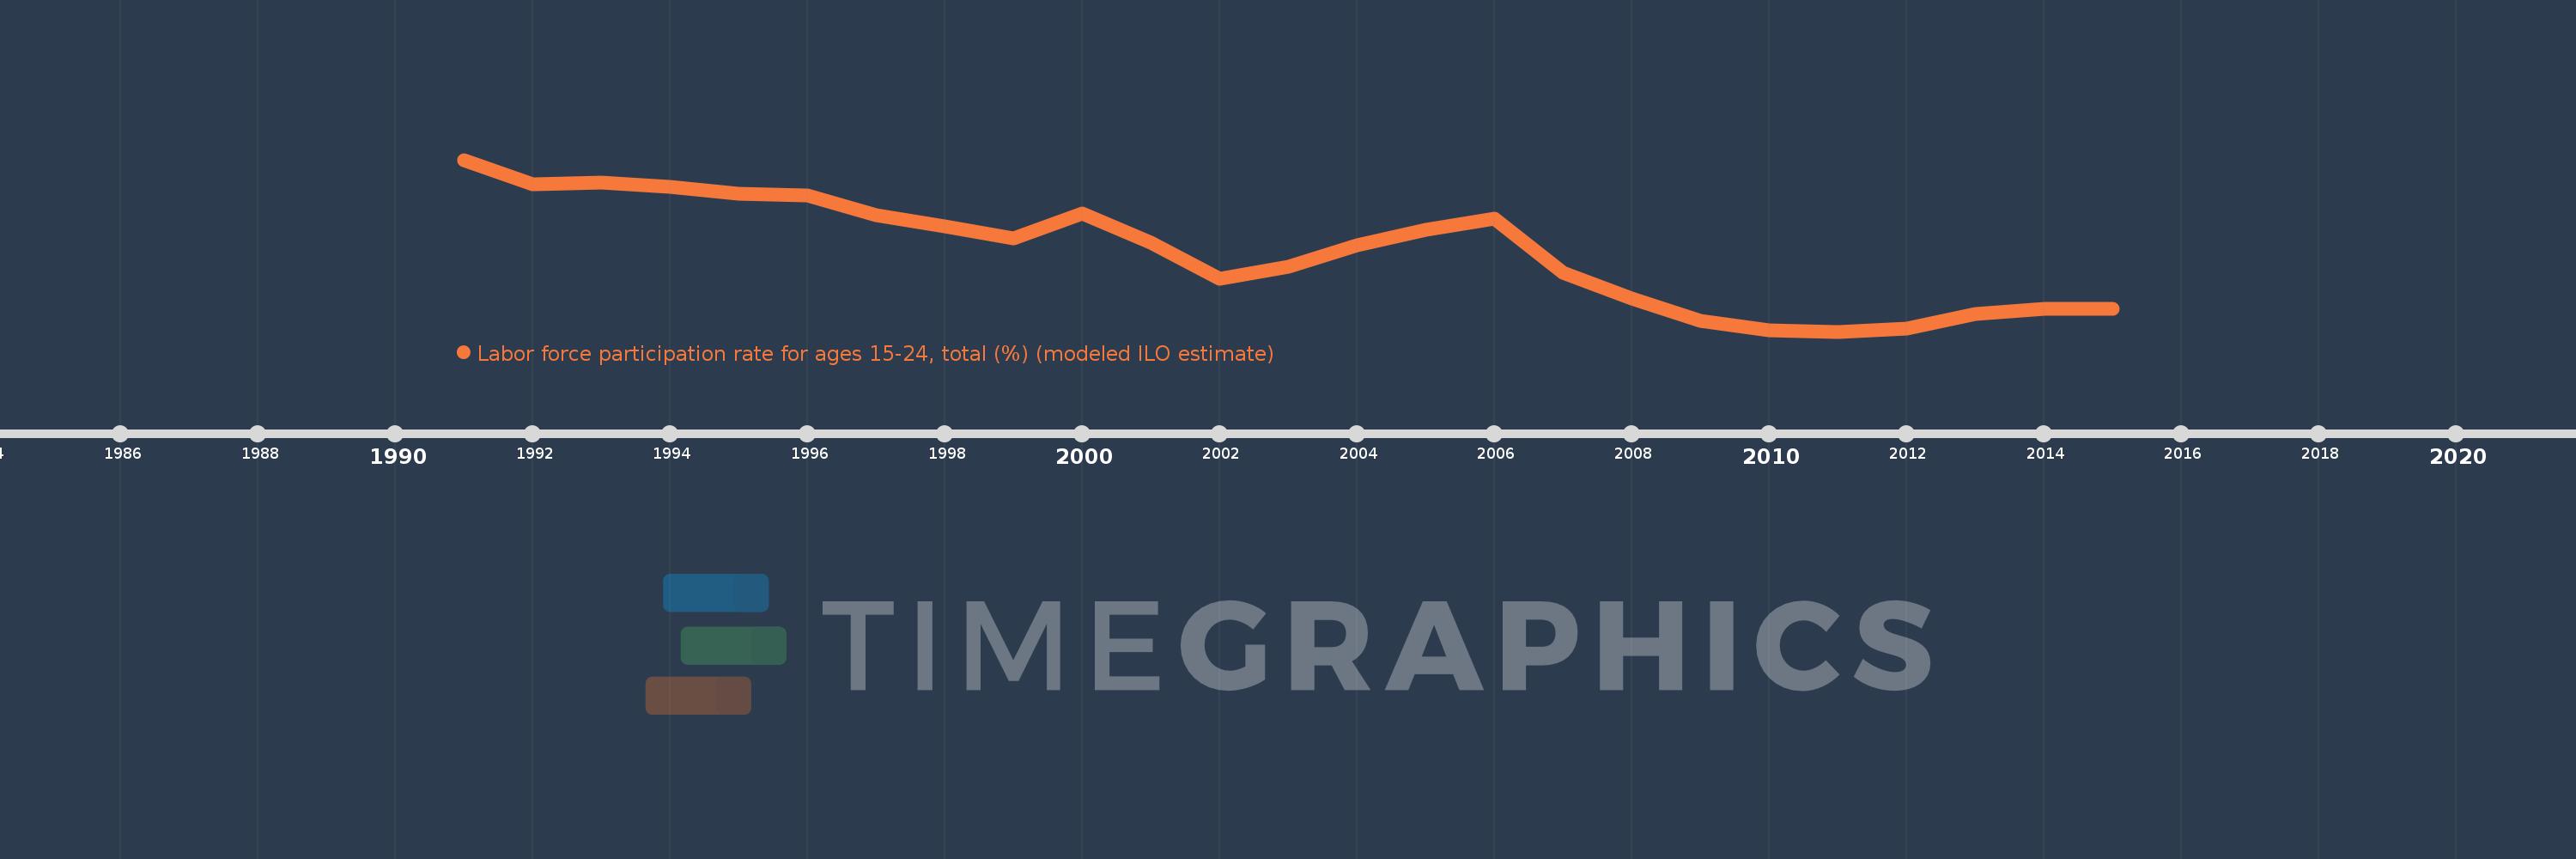
Labor force participation rate for ages 15-24, total (%) (modeled ILO estimate)
2015,2014,2013,2012,2011,2010,2009,2008,2007,2006,2005,2004,2003,2002,2001,2000,1999,1998,1997,1996,1995,1994,1993,1992,1991
This statistics in other country:
AfghanistanAlbaniaAlgeriaAngolaArab WorldArgentinaArmeniaAustraliaAustriaAzerbaijanBahamas, TheBahrainBangladeshBarbadosBelarusBelgiumBelizeBeninBhutanBoliviaBosnia and HerzegovinaBotswanaBrazilBrunei DarussalamBulgariaBurkina FasoBurundiCabo VerdeCambodiaCameroonCanadaCaribbean small statesCentral African RepublicCentral Europe and the BalticsChadChannel IslandsChileChinaColombiaComorosCongo, Dem. Rep.Congo, Rep.Costa RicaCote d'IvoireCroatiaCubaCyprusCzech RepublicDenmarkDjiboutiDominican RepublicEarly-demographic dividendEast Asia & PacificEast Asia & Pacific (excluding high income)East Asia & Pacific (IDA & IBRD countries)EcuadorEgypt, Arab Rep.El SalvadorEquatorial GuineaEritreaEstoniaEthiopiaEuro areaEurope & Central AsiaEurope & Central Asia (excluding high income)Europe & Central Asia (IDA & IBRD countries)European UnionFijiFinlandFragile and conflict affected situationsFranceFrench PolynesiaGabonGambia, TheGeorgiaGermanyGhanaGreeceGuamGuatemalaGuineaGuinea-BissauGuyanaHaitiHeavily indebted poor countries (HIPC)High incomeHondurasHong Kong SAR, ChinaHungaryIBRD onlyIcelandIDA & IBRD totalIDA blendIDA onlyIDA totalIndiaIndonesiaIran, Islamic Rep.IraqIrelandIsraelItalyJamaicaJapanJordanKazakhstanKenyaKorea, Dem. People’s Rep.Korea, Rep.KuwaitKyrgyz RepublicLao PDRLate-demographic dividendLatin America & Caribbean Latin America & Caribbean (excluding high income)Latin America & the Caribbean (IDA & IBRD countries)LatviaLeast developed countries: UN classificationLebanonLesothoLiberiaLibyaLithuaniaLow & middle incomeLow incomeLower middle incomeLuxembourgMacao SAR, ChinaMacedonia, FYRMadagascarMalawiMalaysiaMaldivesMaliMaltaMauritaniaMauritiusMexicoMiddle East & North AfricaMiddle East & North Africa (excluding high income)Middle East & North Africa (IDA & IBRD countries)Middle incomeMoldovaMongoliaMontenegroMoroccoMozambiqueMyanmarNamibiaNepalNetherlandsNew CaledoniaNew ZealandNicaraguaNigerNigeriaNorth AmericaNorwayOECD membersOmanOther small statesPacific island small statesPakistanPanamaPapua New GuineaParaguayPeruPhilippinesPolandPortugalPost-demographic dividendPre-demographic dividendPuerto RicoQatarRomaniaRussian FederationRwandaSamoaSao Tome and PrincipeSaudi ArabiaSenegalSerbiaSierra LeoneSingaporeSlovak RepublicSloveniaSmall statesSolomon IslandsSomaliaSouth AfricaSouth AsiaSouth Asia (IDA & IBRD)SpainSri LankaSt. LuciaSt. Vincent and the GrenadinesSub-Saharan Africa Sub-Saharan Africa (excluding high income)Sub-Saharan Africa (IDA & IBRD countries)SudanSurinameSwazilandSwedenSwitzerlandSyrian Arab RepublicTajikistanTanzaniaThailandTimor-LesteTogoTongaTrinidad and TobagoTunisiaTurkeyTurkmenistanUgandaUkraineUnited Arab EmiratesUnited KingdomUnited StatesUpper middle incomeUruguayUzbekistanVanuatuVenezuela, RBVietnamVirgin Islands (U.S.)West Bank and GazaWorldYemen, Rep.ZambiaZimbabwe Timeline:
This timeline shows a graph from 1991 to 2015 of Middle East & North Africa. No data until 1990. Number of actual observations by date: 25.
Source name:
World Development Indicators
Source organization:
International Labour Organization, Key Indicators of the Labour Market database.
Categories, topics:
Social Protection & Labor, Social Development
Last updated:
apr 23, 2017
Indicators value changes by year
Minimum:
31.765
jan 1, 2011
Maximum:
36.563
jan 1, 1991
At the date of observation
Value
Absolute change
Change from previous value
jan 1, 1991
36.563
+36.563
0.0%
jan 1, 1992
35.889
-0.674
-1.84%
jan 1, 1993
35.934
+0.045
0.13%
jan 1, 1994
35.805
-0.129
-0.36%
jan 1, 1995
35.618
-0.187
-0.52%
jan 1, 1996
35.572
-0.045
-0.13%
jan 1, 1997
35.02
-0.552
-1.55%
jan 1, 1998
34.705
-0.315
-0.9%
jan 1, 1999
34.362
-0.343
-0.99%
jan 1, 2000
35.067
+0.706
2.05%
jan 1, 2001
34.258
-0.809
-2.31%
jan 1, 2002
33.234
-1.024
-2.99%
jan 1, 2003
33.573
+0.339
1.02%
jan 1, 2004
34.167
+0.594
1.77%
jan 1, 2005
34.607
+0.441
1.29%
jan 1, 2006
34.909
+0.302
0.87%
jan 1, 2007
33.398
-1.511
-4.33%
jan 1, 2008
32.699
-0.699
-2.09%
jan 1, 2009
32.076
-0.623
-1.9%
jan 1, 2010
31.789
-0.287
-0.9%
jan 1, 2011
31.765
-0.024
-0.08%
jan 1, 2012
31.845
+0.08
0.25%
jan 1, 2013
32.251
+0.405
1.27%
jan 1, 2014
32.407
+0.156
0.48%
jan 1, 2015
32.4
-0.007
-0.02%
Ranking of countries by current statistics by years


Comments: