29
/
en
AIzaSyAYiBZKx7MnpbEhh9jyipgxe19OcubqV5w
April 1, 2024
48209
Middle East & North Africa
MEA
false
2
1
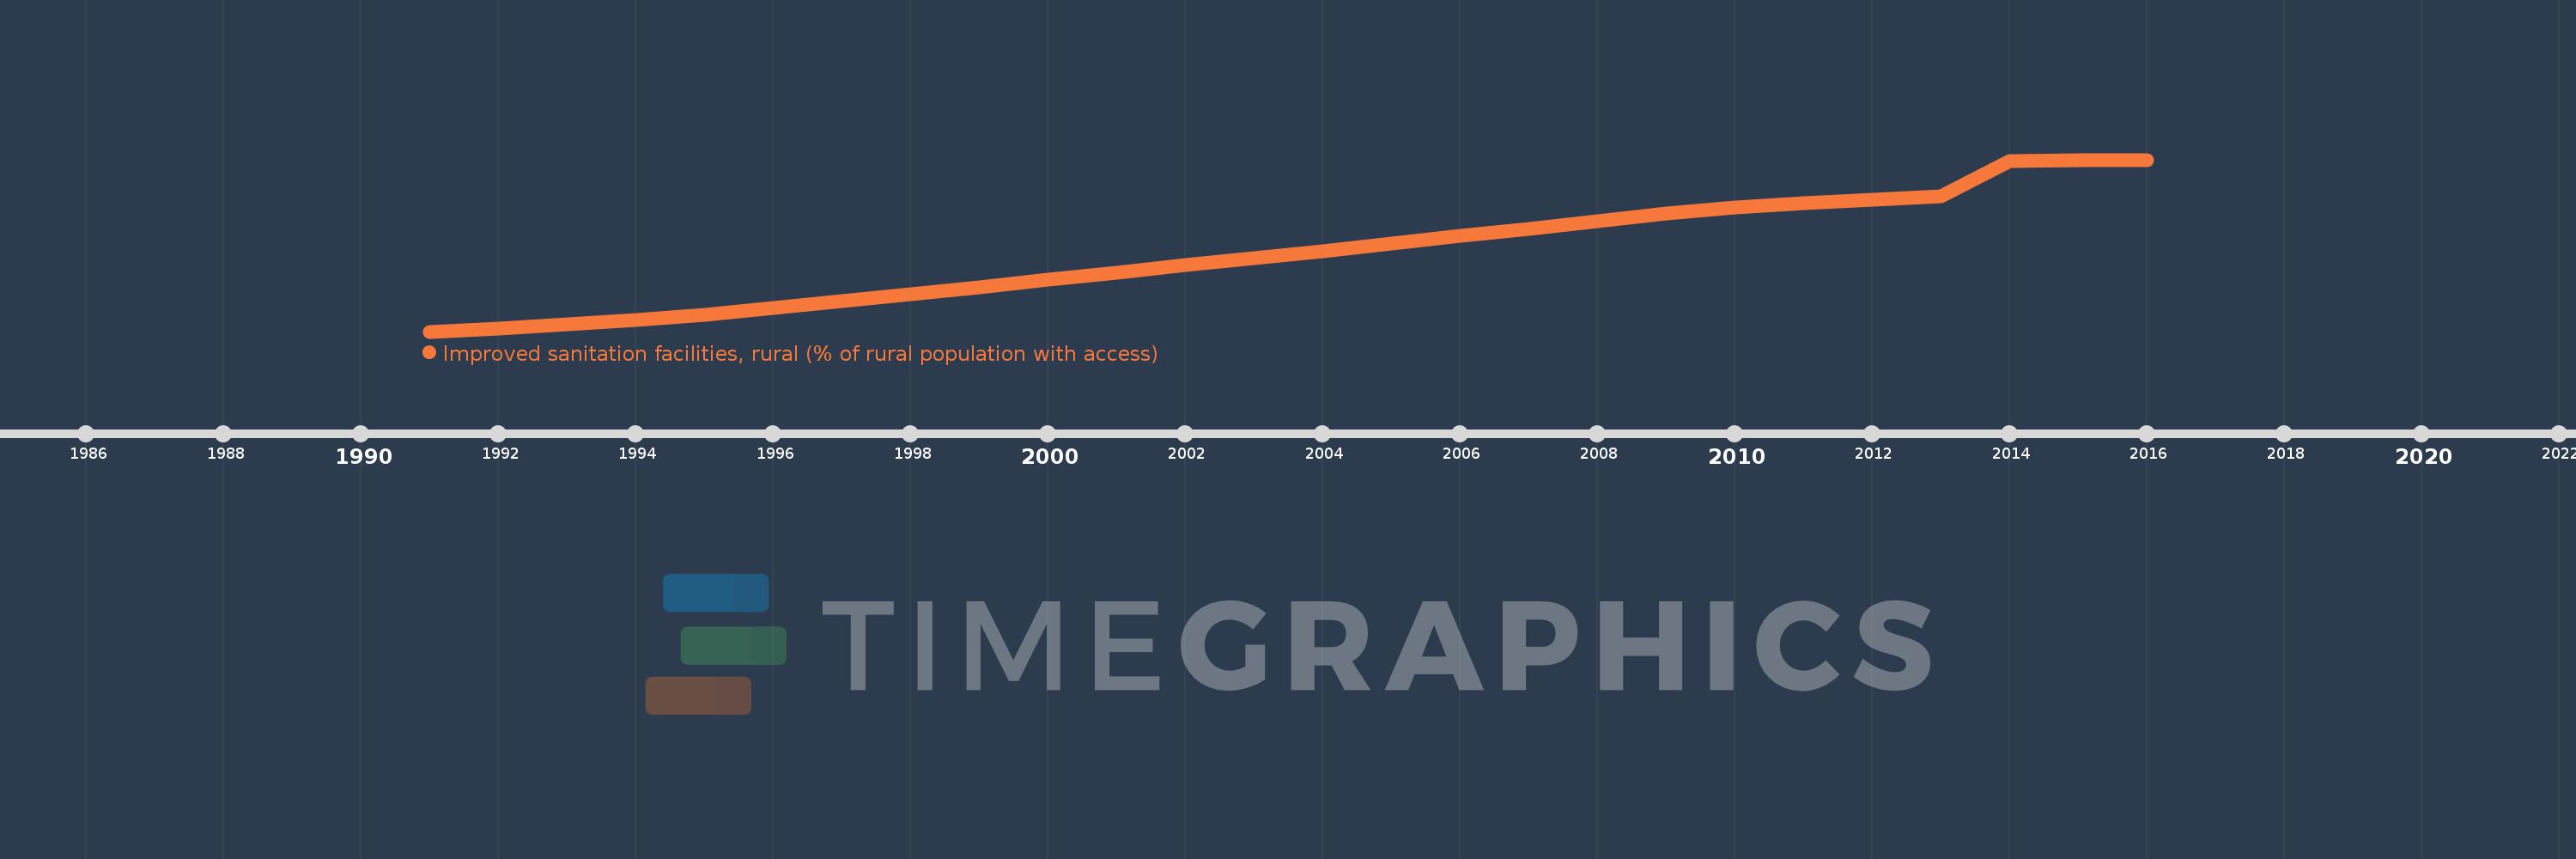
Improved sanitation facilities, rural (% of rural population with access)
2016,2015,2014,2013,2012,2011,2010,2009,2008,2007,2006,2005,2004,2003,2002,2001,2000,1999,1998,1997,1996,1995,1994,1993,1992,1991
This statistics in other country:
AfghanistanAlbaniaAlgeriaAmerican SamoaAndorraAngolaAntigua and BarbudaArab WorldArgentinaArmeniaArubaAustraliaAustriaAzerbaijanBahamas, TheBahrainBangladeshBarbadosBelarusBelgiumBelizeBeninBhutanBoliviaBosnia and HerzegovinaBotswanaBrazilBritish Virgin IslandsBulgariaBurkina FasoBurundiCabo VerdeCambodiaCameroonCanadaCaribbean small statesCentral African RepublicCentral Europe and the BalticsChadChileChinaColombiaComorosCongo, Dem. Rep.Congo, Rep.Costa RicaCote d'IvoireCroatiaCubaCyprusCzech RepublicDenmarkDjiboutiDominicaDominican RepublicEarly-demographic dividendEast Asia & PacificEast Asia & Pacific (excluding high income)East Asia & Pacific (IDA & IBRD countries)EcuadorEgypt, Arab Rep.El SalvadorEquatorial GuineaEritreaEstoniaEthiopiaEuro areaEurope & Central AsiaEurope & Central Asia (excluding high income)Europe & Central Asia (IDA & IBRD countries)European UnionFijiFinlandFragile and conflict affected situationsFranceFrench PolynesiaGabonGambia, TheGeorgiaGermanyGhanaGreeceGreenlandGrenadaGuamGuatemalaGuineaGuinea-BissauGuyanaHaitiHeavily indebted poor countries (HIPC)High incomeHondurasHungaryIBRD onlyIcelandIDA & IBRD totalIDA blendIDA onlyIDA totalIndiaIndonesiaIran, Islamic Rep.IraqIrelandIsraelItalyJamaicaJapanJordanKazakhstanKenyaKiribatiKorea, Dem. People’s Rep.Korea, Rep.KuwaitKyrgyz RepublicLao PDRLate-demographic dividendLatin America & Caribbean Latin America & Caribbean (excluding high income)Latin America & the Caribbean (IDA & IBRD countries)LatviaLeast developed countries: UN classificationLebanonLesothoLiberiaLibyaLithuaniaLow & middle incomeLow incomeLower middle incomeLuxembourgMacedonia, FYRMadagascarMalawiMalaysiaMaldivesMaliMaltaMarshall IslandsMauritaniaMauritiusMexicoMicronesia, Fed. Sts.Middle East & North AfricaMiddle East & North Africa (excluding high income)Middle East & North Africa (IDA & IBRD countries)Middle incomeMoldovaMongoliaMontenegroMoroccoMozambiqueMyanmarNamibiaNepalNetherlandsNew CaledoniaNew ZealandNicaraguaNigerNigeriaNorth AmericaNorthern Mariana IslandsNorwayOECD membersOmanOther small statesPacific island small statesPakistanPalauPanamaPapua New GuineaParaguayPeruPhilippinesPolandPortugalPost-demographic dividendPre-demographic dividendPuerto RicoQatarRomaniaRussian FederationRwandaSamoaSao Tome and PrincipeSaudi ArabiaSenegalSerbiaSeychellesSierra LeoneSlovak RepublicSloveniaSmall statesSolomon IslandsSomaliaSouth AfricaSouth AsiaSouth Asia (IDA & IBRD)South SudanSpainSri LankaSt. Kitts and NevisSt. LuciaSt. Vincent and the GrenadinesSub-Saharan Africa Sub-Saharan Africa (excluding high income)Sub-Saharan Africa (IDA & IBRD countries)SudanSurinameSwazilandSwedenSwitzerlandSyrian Arab RepublicTajikistanTanzaniaThailandTimor-LesteTogoTongaTrinidad and TobagoTunisiaTurkeyTurkmenistanTurks and Caicos IslandsTuvaluUgandaUkraineUnited Arab EmiratesUnited KingdomUnited StatesUpper middle incomeUruguayUzbekistanVanuatuVenezuela, RBVietnamVirgin Islands (U.S.)West Bank and GazaWorldYemen, Rep.ZambiaZimbabwe Timeline:
This timeline shows a graph from 1991 to 2016 of Middle East & North Africa. No data until 1990. Number of actual observations by date: 26.
Source name:
World Development Indicators
Source organization:
WHO/UNICEF Joint Monitoring Programme (JMP) for Water Supply and Sanitation (http://www.wssinfo.org/).
Categories, topics:
Agriculture & Rural Development, Health
Last updated:
apr 23, 2017
Indicators value changes by year
Minimum:
55.253
jan 1, 1991
Maximum:
86.838
jan 1, 2016
At the date of observation
Value
Absolute change
Change from previous value
jan 1, 1991
55.253
+55.253
0.0%
jan 1, 1992
55.823
+0.57
1.03%
jan 1, 1993
56.548
+0.725
1.3%
jan 1, 1994
57.337
+0.789
1.4%
jan 1, 1995
58.406
+1.07
1.87%
jan 1, 1996
59.542
+1.136
1.95%
jan 1, 1997
60.809
+1.267
2.13%
jan 1, 1998
62.084
+1.275
2.1%
jan 1, 1999
63.463
+1.379
2.22%
jan 1, 2000
64.802
+1.339
2.11%
jan 1, 2001
66.096
+1.294
2.0%
jan 1, 2002
67.419
+1.323
2.0%
jan 1, 2003
68.755
+1.336
1.98%
jan 1, 2004
70.08
+1.325
1.93%
jan 1, 2005
71.44
+1.359
1.94%
jan 1, 2006
72.784
+1.344
1.88%
jan 1, 2007
74.176
+1.393
1.91%
jan 1, 2008
75.555
+1.379
1.86%
jan 1, 2009
76.901
+1.345
1.78%
jan 1, 2010
78.137
+1.236
1.61%
jan 1, 2011
78.927
+0.79
1.01%
jan 1, 2012
79.553
+0.626
0.79%
jan 1, 2013
80.145
+0.591
0.74%
jan 1, 2014
86.611
+6.467
8.07%
jan 1, 2015
86.738
+0.127
0.15%
jan 1, 2016
86.838
+0.1
0.12%
Ranking of countries by current statistics by years


Comments: