29
/
en
AIzaSyAYiBZKx7MnpbEhh9jyipgxe19OcubqV5w
April 1, 2024
47931
Middle East & North Africa
MEA
false
2
1
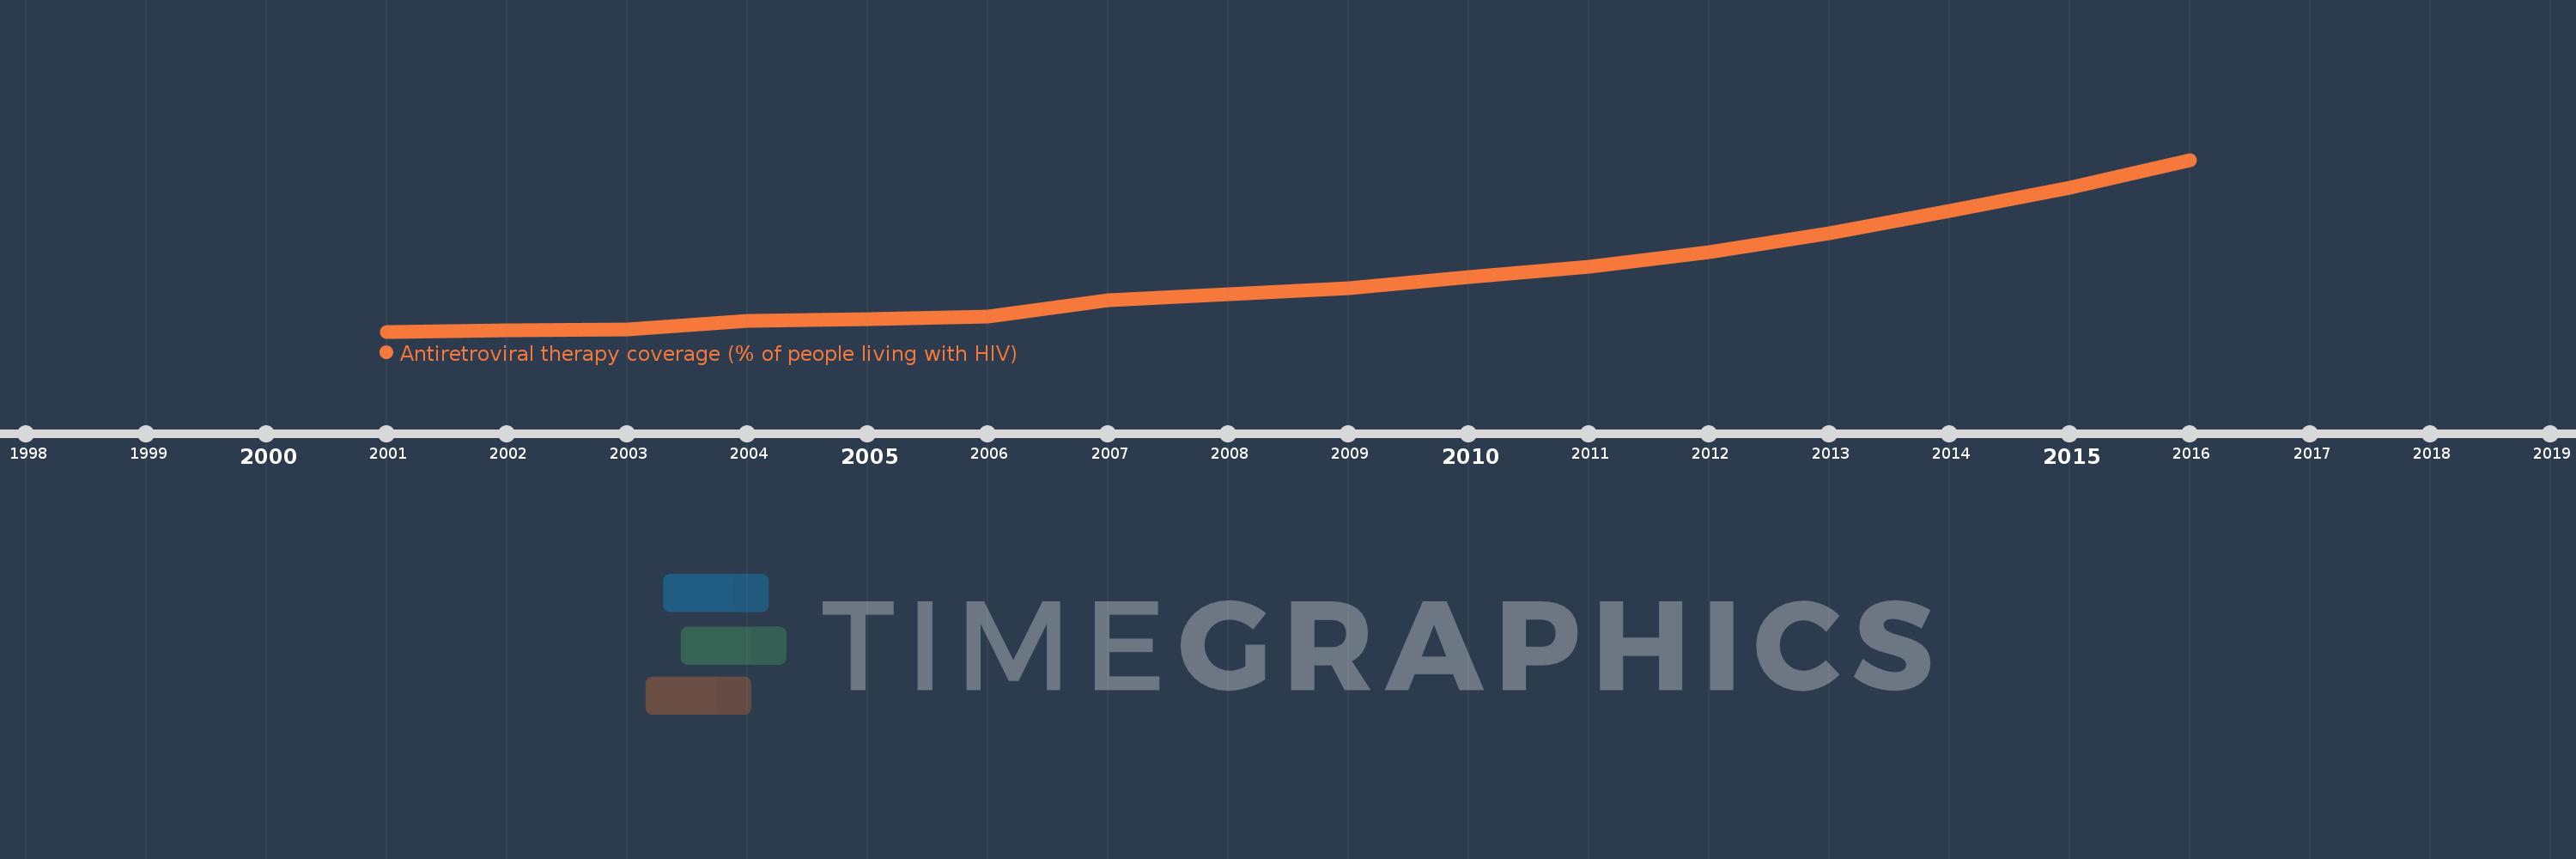
Antiretroviral therapy coverage (% of people living with HIV)
2016,2015,2014,2013,2012,2011,2010,2009,2008,2007,2006,2005,2004,2003,2002,2001
This statistics in other country:
Timeline:
This timeline shows a graph from 2001 to 2016 of Middle East & North Africa. No data until 2000. Number of actual observations by date: 16.
Source name:
World Development Indicators
Source organization:
UNAIDS estimates.
Categories, topics:
Health
Last updated:
apr 23, 2017
Indicators value changes by year
Maximum:
21.674
jan 1, 2016
At the date of observation
Value
Absolute change
Change from previous value
jan 1, 2001
0.476
+0.476
0.0%
jan 1, 2002
0.584
+0.107
22.56%
jan 1, 2003
0.71
+0.126
21.59%
jan 1, 2004
1.754
+1.044
147.12%
jan 1, 2005
2.01
+0.256
14.6%
jan 1, 2006
2.358
+0.349
17.35%
jan 1, 2007
4.315
+1.956
82.95%
jan 1, 2008
5.043
+0.728
16.88%
jan 1, 2009
5.861
+0.818
16.22%
jan 1, 2010
7.17
+1.31
22.34%
jan 1, 2011
8.442
+1.272
17.73%
jan 1, 2012
10.23
+1.788
21.18%
jan 1, 2013
12.563
+2.334
22.81%
jan 1, 2014
15.315
+2.751
21.9%
jan 1, 2015
18.271
+2.956
19.3%
jan 1, 2016
21.674
+3.403
18.63%
Ranking of countries by current statistics by years


Comments: