29
/
en
AIzaSyAYiBZKx7MnpbEhh9jyipgxe19OcubqV5w
April 1, 2024
47468
Lower middle income
LMC
false
2
1
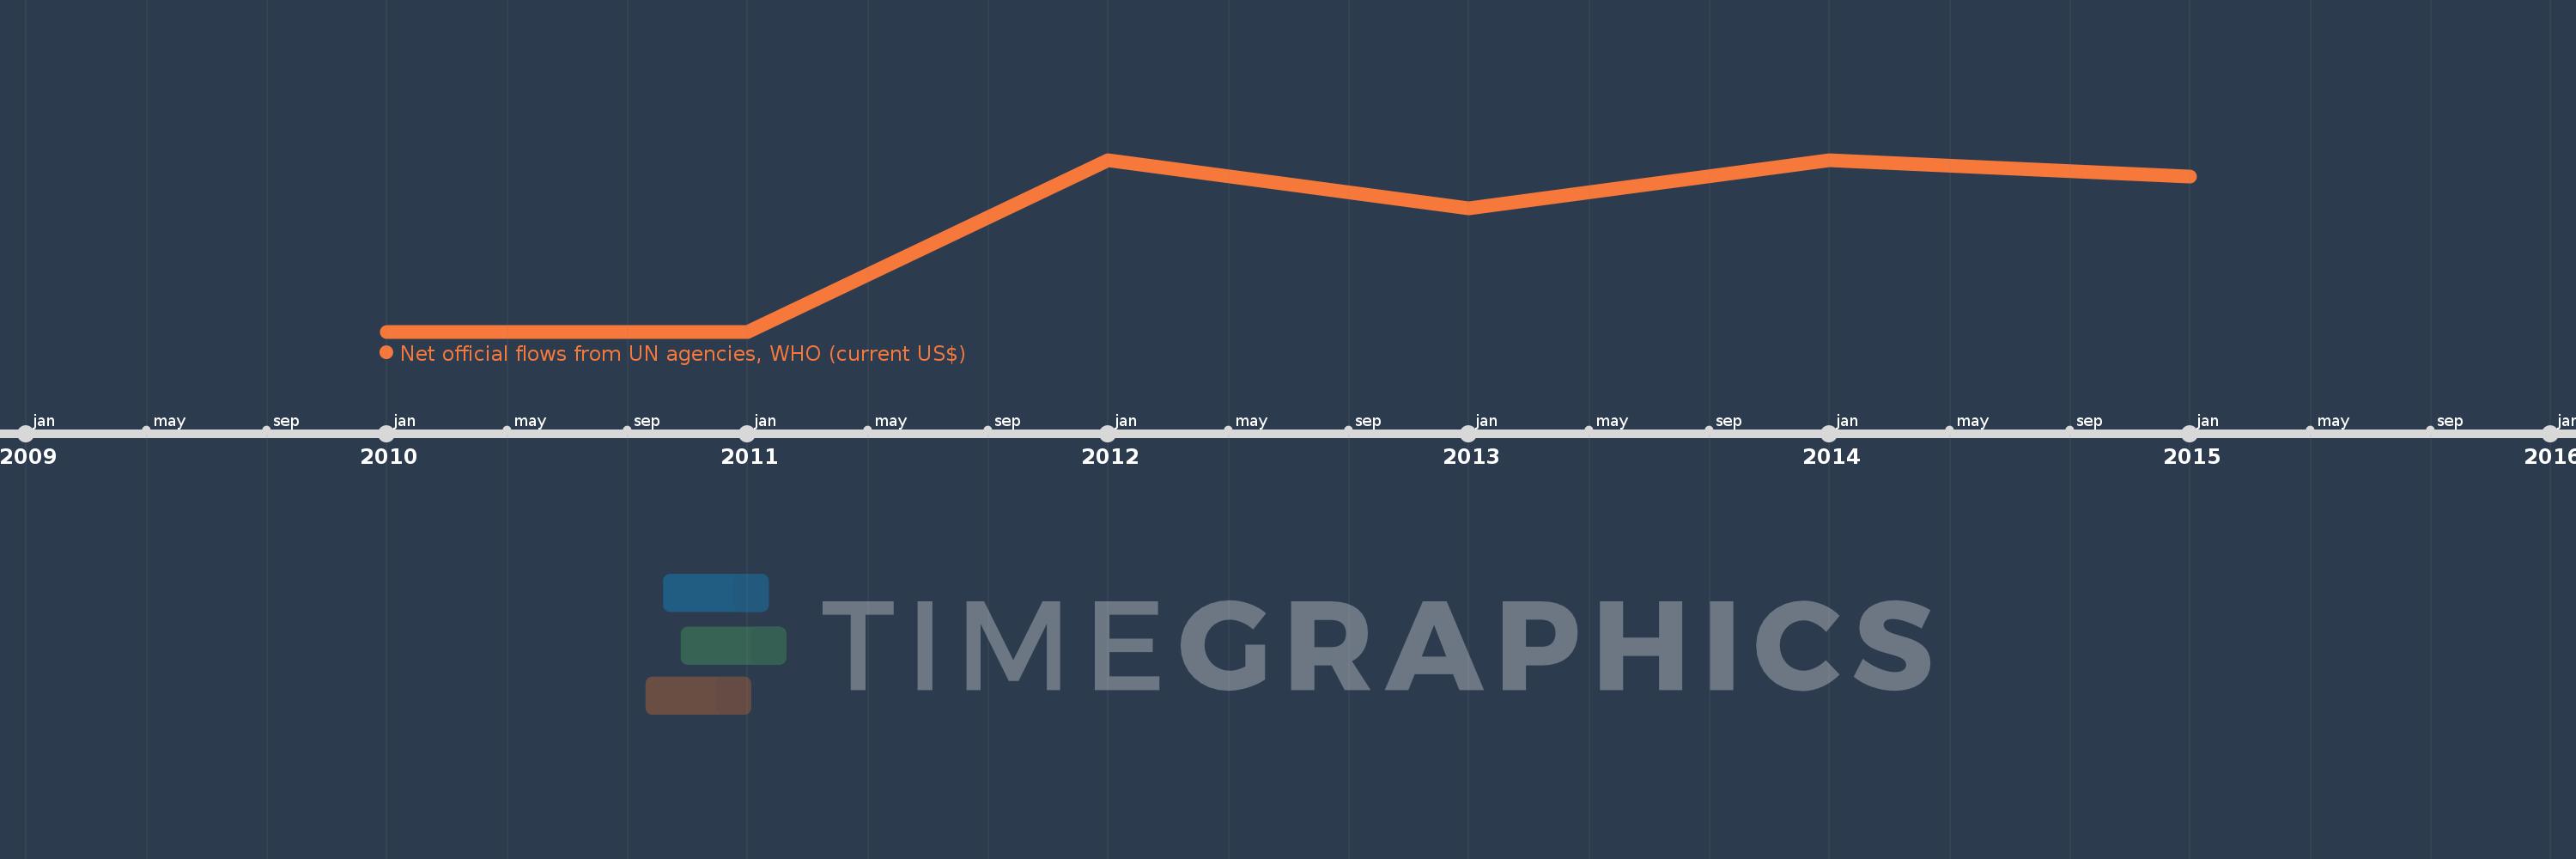
Net official flows from UN agencies, WHO (current US$)
2015,2014,2013,2012,2011,2010
This statistics in other country:
Timeline:
This timeline shows a graph from 2010 to 2015 of Lower middle income. No data until 2009. Number of actual observations by date: 6.
Source name:
World Development Indicators
Source organization:
Development Assistance Committee of the Organisation for Economic Co-operation and Development, Geographical Distribution of Financial Flows to Developing Countries, Development Co-operation Report, and International Development Statistics database. Data are available online at: www.oecd.org/dac/stats/idsonline.
Categories, topics:
Aid Effectiveness
Last updated:
apr 23, 2017
Indicators value changes by year
Maximum:
70.26 mln
jan 1, 2012
At the date of observation
Value
Absolute change
Change from previous value
jan 1, 2012
70.26 mln
+70.26 mln
%
jan 1, 2013
50.39 mln
-19.87 mln
-28.28%
jan 1, 2014
70.12 mln
+19.73 mln
39.15%
jan 1, 2015
63.26 mln
-6.86 mln
-9.78%
Ranking of countries by current statistics by years


Comments: