29
/
en
AIzaSyAYiBZKx7MnpbEhh9jyipgxe19OcubqV5w
April 1, 2024
46861
Lower middle income
LMC
false
2
1
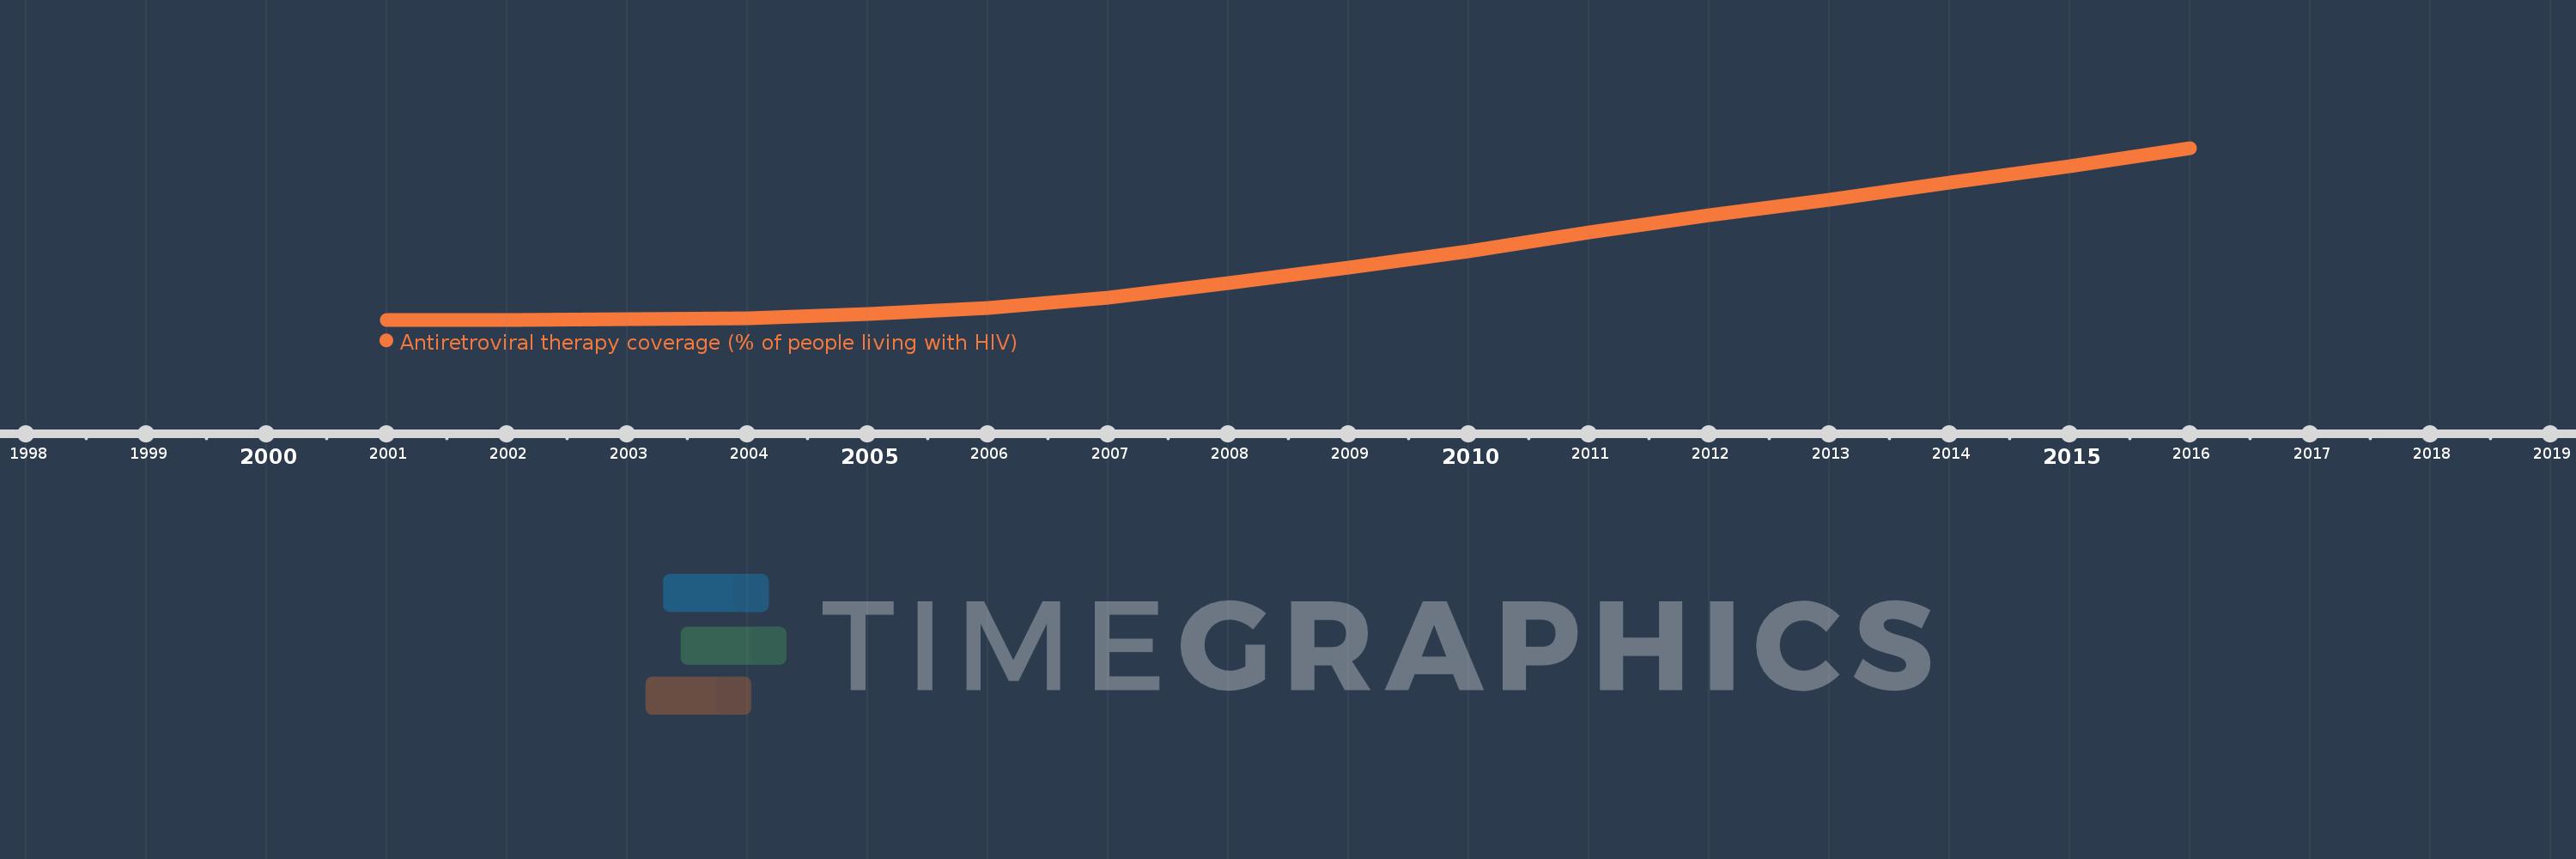
Antiretroviral therapy coverage (% of people living with HIV)
2016,2015,2014,2013,2012,2011,2010,2009,2008,2007,2006,2005,2004,2003,2002,2001
This statistics in other country:
Timeline:
This timeline shows a graph from 2001 to 2016 of Lower middle income. No data until 2000. Number of actual observations by date: 16.
Source name:
World Development Indicators
Source organization:
UNAIDS estimates.
Categories, topics:
Health
Last updated:
apr 23, 2017
Indicators value changes by year
Maximum:
43.437
jan 1, 2016
At the date of observation
Value
Absolute change
Change from previous value
jan 1, 2003
0.048
+0.027
136.47%
jan 1, 2004
0.469
+0.422
884.81%
jan 1, 2005
1.373
+0.904
192.6%
jan 1, 2006
2.967
+1.594
116.15%
jan 1, 2007
5.659
+2.692
90.72%
jan 1, 2008
9.371
+3.712
65.6%
jan 1, 2009
13.222
+3.851
41.09%
jan 1, 2010
17.266
+4.044
30.58%
jan 1, 2011
22.013
+4.747
27.49%
jan 1, 2012
26.391
+4.378
19.89%
jan 1, 2013
30.307
+3.917
14.84%
jan 1, 2014
34.588
+4.281
14.13%
jan 1, 2015
38.912
+4.324
12.5%
jan 1, 2016
43.437
+4.525
11.63%
Ranking of countries by current statistics by years


Comments: