29
/
en
AIzaSyAYiBZKx7MnpbEhh9jyipgxe19OcubqV5w
April 1, 2024
45979
Low income
LIC
false
2
1
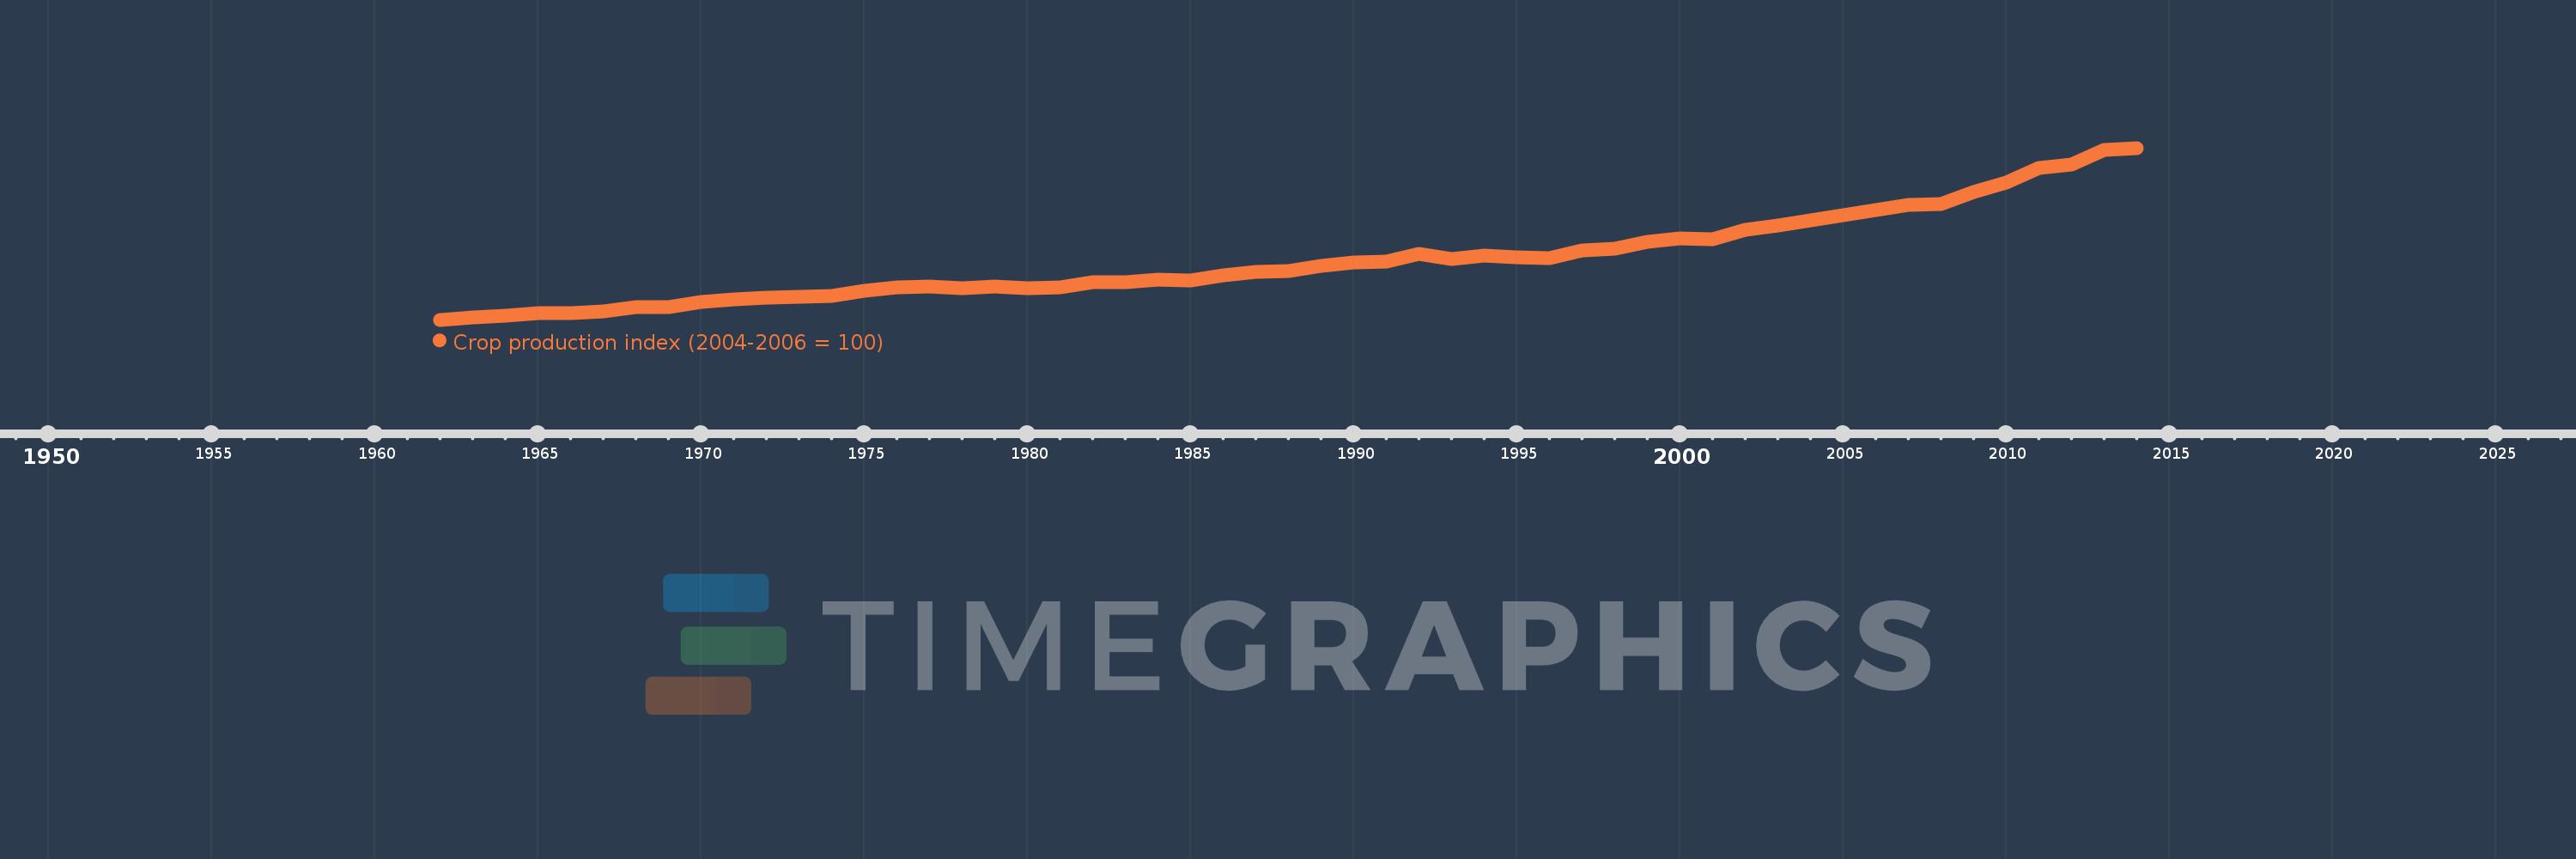
Crop production index (2004-2006 = 100)
2014,2013,2012,2011,2010,2009,2008,2007,2006,2005,2004,2003,2002,2001,2000,1999,1998,1997,1996,1995,1994,1993,1992,1991,1990,1989,1988,1987,1986,1985,1984,1983,1982,1981,1980,1979,1978,1977,1976,1975,1974,1973,1972,1971,1970,1969,1968,1967,1966,1965,1964,1963,1962
This statistics in other country:
AfghanistanAlbaniaAlgeriaAmerican SamoaAngolaAntigua and BarbudaArab WorldArgentinaArmeniaAustraliaAustriaAzerbaijanBahamas, TheBahrainBangladeshBarbadosBelarusBelgiumBelizeBeninBermudaBhutanBoliviaBosnia and HerzegovinaBotswanaBrazilBritish Virgin IslandsBrunei DarussalamBulgariaBurkina FasoBurundiCabo VerdeCambodiaCameroonCanadaCaribbean small statesCayman IslandsCentral African RepublicCentral Europe and the BalticsChadChileChinaColombiaComorosCongo, Dem. Rep.Congo, Rep.Costa RicaCote d'IvoireCroatiaCubaCyprusCzech RepublicDenmarkDjiboutiDominicaDominican RepublicEarly-demographic dividendEast Asia & PacificEast Asia & Pacific (excluding high income)East Asia & Pacific (IDA & IBRD countries)EcuadorEgypt, Arab Rep.El SalvadorEquatorial GuineaEritreaEstoniaEthiopiaEuro areaEurope & Central AsiaEurope & Central Asia (excluding high income)Europe & Central Asia (IDA & IBRD countries)European UnionFaroe IslandsFijiFinlandFragile and conflict affected situationsFranceFrench PolynesiaGabonGambia, TheGeorgiaGermanyGhanaGreeceGrenadaGuamGuatemalaGuineaGuinea-BissauGuyanaHaitiHeavily indebted poor countries (HIPC)High incomeHondurasHong Kong SAR, ChinaHungaryIBRD onlyIcelandIDA & IBRD totalIDA blendIDA onlyIDA totalIndiaIndonesiaIran, Islamic Rep.IraqIrelandIsraelItalyJamaicaJapanJordanKazakhstanKenyaKiribatiKorea, Dem. People’s Rep.Korea, Rep.KuwaitKyrgyz RepublicLao PDRLate-demographic dividendLatin America & Caribbean Latin America & Caribbean (excluding high income)Latin America & the Caribbean (IDA & IBRD countries)LatviaLeast developed countries: UN classificationLebanonLesothoLiberiaLibyaLiechtensteinLithuaniaLow & middle incomeLow incomeLower middle incomeLuxembourgMacao SAR, ChinaMacedonia, FYRMadagascarMalawiMalaysiaMaldivesMaliMaltaMarshall IslandsMauritaniaMauritiusMexicoMicronesia, Fed. Sts.Middle East & North AfricaMiddle East & North Africa (excluding high income)Middle East & North Africa (IDA & IBRD countries)Middle incomeMoldovaMongoliaMontenegroMoroccoMozambiqueMyanmarNamibiaNauruNepalNetherlandsNew CaledoniaNew ZealandNicaraguaNigerNigeriaNorth AmericaNorwayOECD membersOmanOther small statesPacific island small statesPakistanPanamaPapua New GuineaParaguayPeruPhilippinesPolandPortugalPost-demographic dividendPre-demographic dividendPuerto RicoQatarRomaniaRussian FederationRwandaSamoaSao Tome and PrincipeSaudi ArabiaSenegalSerbiaSeychellesSierra LeoneSingaporeSlovak RepublicSloveniaSmall statesSolomon IslandsSomaliaSouth AfricaSouth AsiaSouth Asia (IDA & IBRD)SpainSri LankaSt. Kitts and NevisSt. LuciaSt. Vincent and the GrenadinesSub-Saharan Africa Sub-Saharan Africa (excluding high income)Sub-Saharan Africa (IDA & IBRD countries)SudanSurinameSwazilandSwedenSwitzerlandSyrian Arab RepublicTajikistanTanzaniaThailandTimor-LesteTogoTongaTrinidad and TobagoTunisiaTurkeyTurkmenistanTuvaluUgandaUkraineUnited Arab EmiratesUnited KingdomUnited StatesUpper middle incomeUruguayUzbekistanVanuatuVenezuela, RBVietnamWest Bank and GazaWorldYemen, Rep.ZambiaZimbabwe Timeline:
This timeline shows a graph from 1962 to 2014 of Low income. No data until 1961. Number of actual observations by date: 53.
Source name:
World Development Indicators
Source organization:
Food and Agriculture Organization, electronic files and web site.
Categories, topics:
Agriculture & Rural Development
Last updated:
apr 23, 2017
Indicators value changes by year
Minimum:
37.826
jan 1, 1962
Maximum:
135.254
jan 1, 2014
At the date of observation
Value
Absolute change
Change from previous value
jan 1, 1962
37.826
+37.826
0.0%
jan 1, 1963
39.265
+1.439
3.8%
jan 1, 1964
40.178
+0.913
2.33%
jan 1, 1965
41.643
+1.465
3.65%
jan 1, 1966
41.383
-0.26
-0.63%
jan 1, 1967
42.48
+1.098
2.65%
jan 1, 1968
44.852
+2.372
5.58%
jan 1, 1969
45.1
+0.248
0.55%
jan 1, 1970
48.014
+2.914
6.46%
jan 1, 1971
49.212
+1.199
2.5%
jan 1, 1972
50.466
+1.254
2.55%
jan 1, 1973
50.639
+0.173
0.34%
jan 1, 1974
51.488
+0.848
1.68%
jan 1, 1975
54.159
+2.671
5.19%
jan 1, 1976
56.023
+1.864
3.44%
jan 1, 1977
56.758
+0.735
1.31%
jan 1, 1978
55.772
-0.986
-1.74%
jan 1, 1979
56.915
+1.143
2.05%
jan 1, 1980
55.661
-1.254
-2.2%
jan 1, 1981
56.422
+0.761
1.37%
jan 1, 1982
58.883
+2.461
4.36%
jan 1, 1983
59.038
+0.156
0.26%
jan 1, 1984
60.413
+1.375
2.33%
jan 1, 1985
60.103
-0.311
-0.51%
jan 1, 1986
63.237
+3.135
5.22%
jan 1, 1987
64.958
+1.72
2.72%
jan 1, 1988
65.271
+0.314
0.48%
jan 1, 1989
68.37
+3.099
4.75%
jan 1, 1990
70.116
+1.746
2.55%
jan 1, 1991
71.046
+0.93
1.33%
jan 1, 1992
75.347
+4.301
6.05%
jan 1, 1993
72.133
-3.214
-4.26%
jan 1, 1994
74.099
+1.966
2.73%
jan 1, 1995
73.413
-0.686
-0.93%
jan 1, 1996
72.876
-0.537
-0.73%
jan 1, 1997
77.381
+4.505
6.18%
jan 1, 1998
78.227
+0.846
1.09%
jan 1, 1999
81.77
+3.543
4.53%
jan 1, 2000
83.779
+2.009
2.46%
jan 1, 2001
83.377
-0.402
-0.48%
jan 1, 2002
88.95
+5.573
6.68%
jan 1, 2003
91.202
+2.252
2.53%
jan 1, 2004
93.983
+2.78
3.05%
jan 1, 2005
96.884
+2.901
3.09%
jan 1, 2006
100.161
+3.277
3.38%
jan 1, 2007
102.955
+2.794
2.79%
jan 1, 2008
103.68
+0.725
0.7%
jan 1, 2009
110.138
+6.459
6.23%
jan 1, 2010
115.38
+5.241
4.76%
jan 1, 2011
124.124
+8.744
7.58%
jan 1, 2012
125.848
+1.725
1.39%
jan 1, 2013
133.954
+8.106
6.44%
jan 1, 2014
135.254
+1.3
0.97%
Ranking of countries by current statistics by years


Comments: