29
/
en
AIzaSyAYiBZKx7MnpbEhh9jyipgxe19OcubqV5w
April 1, 2024
45894
Low income
LIC
false
2
1
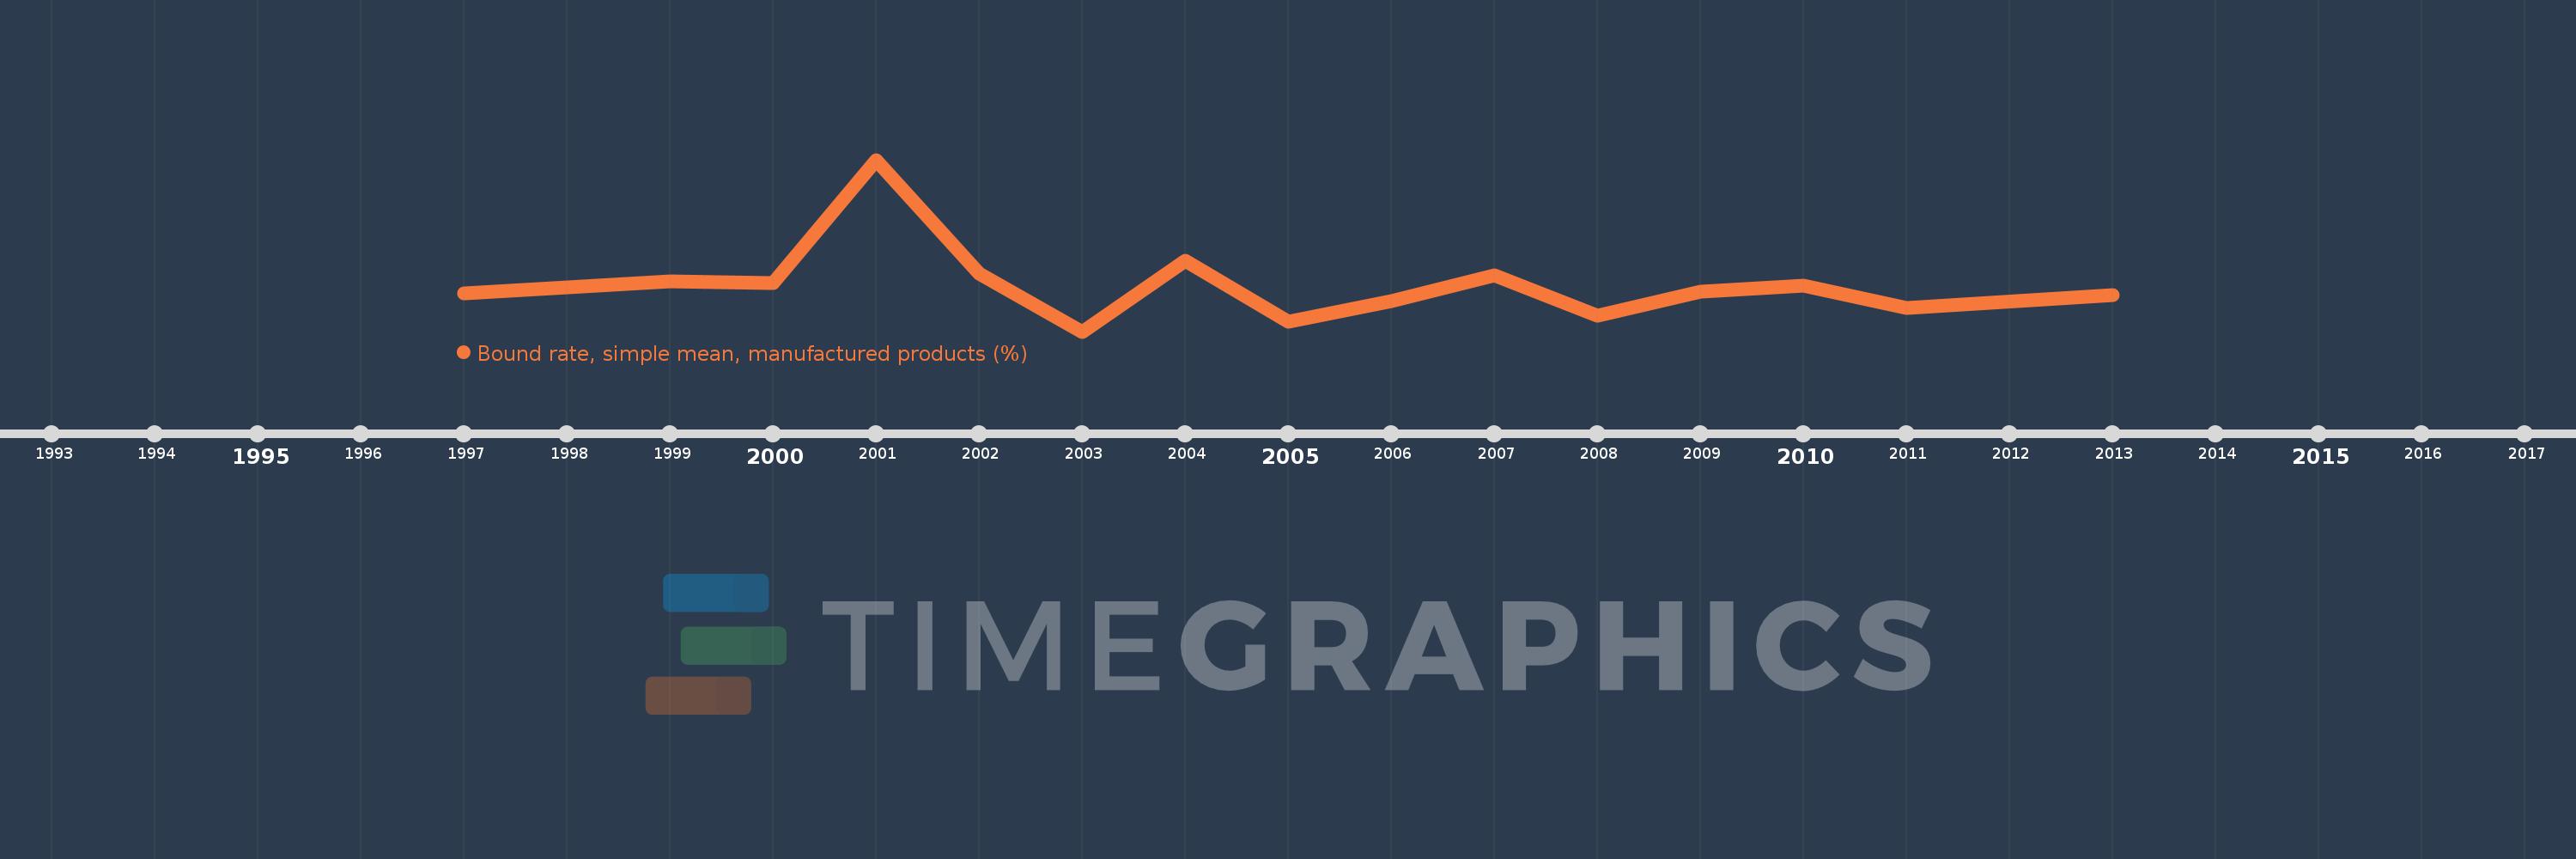
Bound rate, simple mean, manufactured products (%)
2013,2011,2010,2009,2008,2007,2006,2005,2004,2003,2002,2001,2000,1999,1998,1997
This statistics in other country:
Timeline:
This timeline shows a graph from 1997 to 2013 of Low income. No data until 1996. Number of actual observations by date: 16.
Source name:
World Development Indicators
Source organization:
World Bank staff estimates using the World Integrated Trade Solution system, based on data from World Trade Organization.
Categories, topics:
Private Sector, Trade
Last updated:
apr 23, 2017
Indicators value changes by year
At the date of observation
Value
Absolute change
Change from previous value
jan 1, 1997
39.97
+39.97
0.0%
jan 1, 1998
41.75
+1.78
4.45%
jan 1, 1999
43.39
+1.64
3.93%
jan 1, 2000
42.84
-0.55
-1.27%
jan 1, 2001
77.02
+34.18
79.79%
jan 1, 2002
45.52
-31.5
-40.9%
jan 1, 2003
29.46
-16.06
-35.28%
jan 1, 2004
48.99
+19.53
66.29%
jan 1, 2005
32.08
-16.91
-34.52%
jan 1, 2006
37.89
+5.81
18.11%
jan 1, 2007
45.12
+7.23
19.08%
jan 1, 2008
33.88
-11.24
-24.91%
jan 1, 2009
40.58
+6.7
19.78%
jan 1, 2010
42.15
+1.57
3.87%
jan 1, 2011
35.9
-6.25
-14.83%
jan 1, 2013
39.63
+3.73
10.39%
Ranking of countries by current statistics by years


Comments: