29
/
en
AIzaSyAYiBZKx7MnpbEhh9jyipgxe19OcubqV5w
April 1, 2024
45238
Low & middle income
LMY
false
2
1
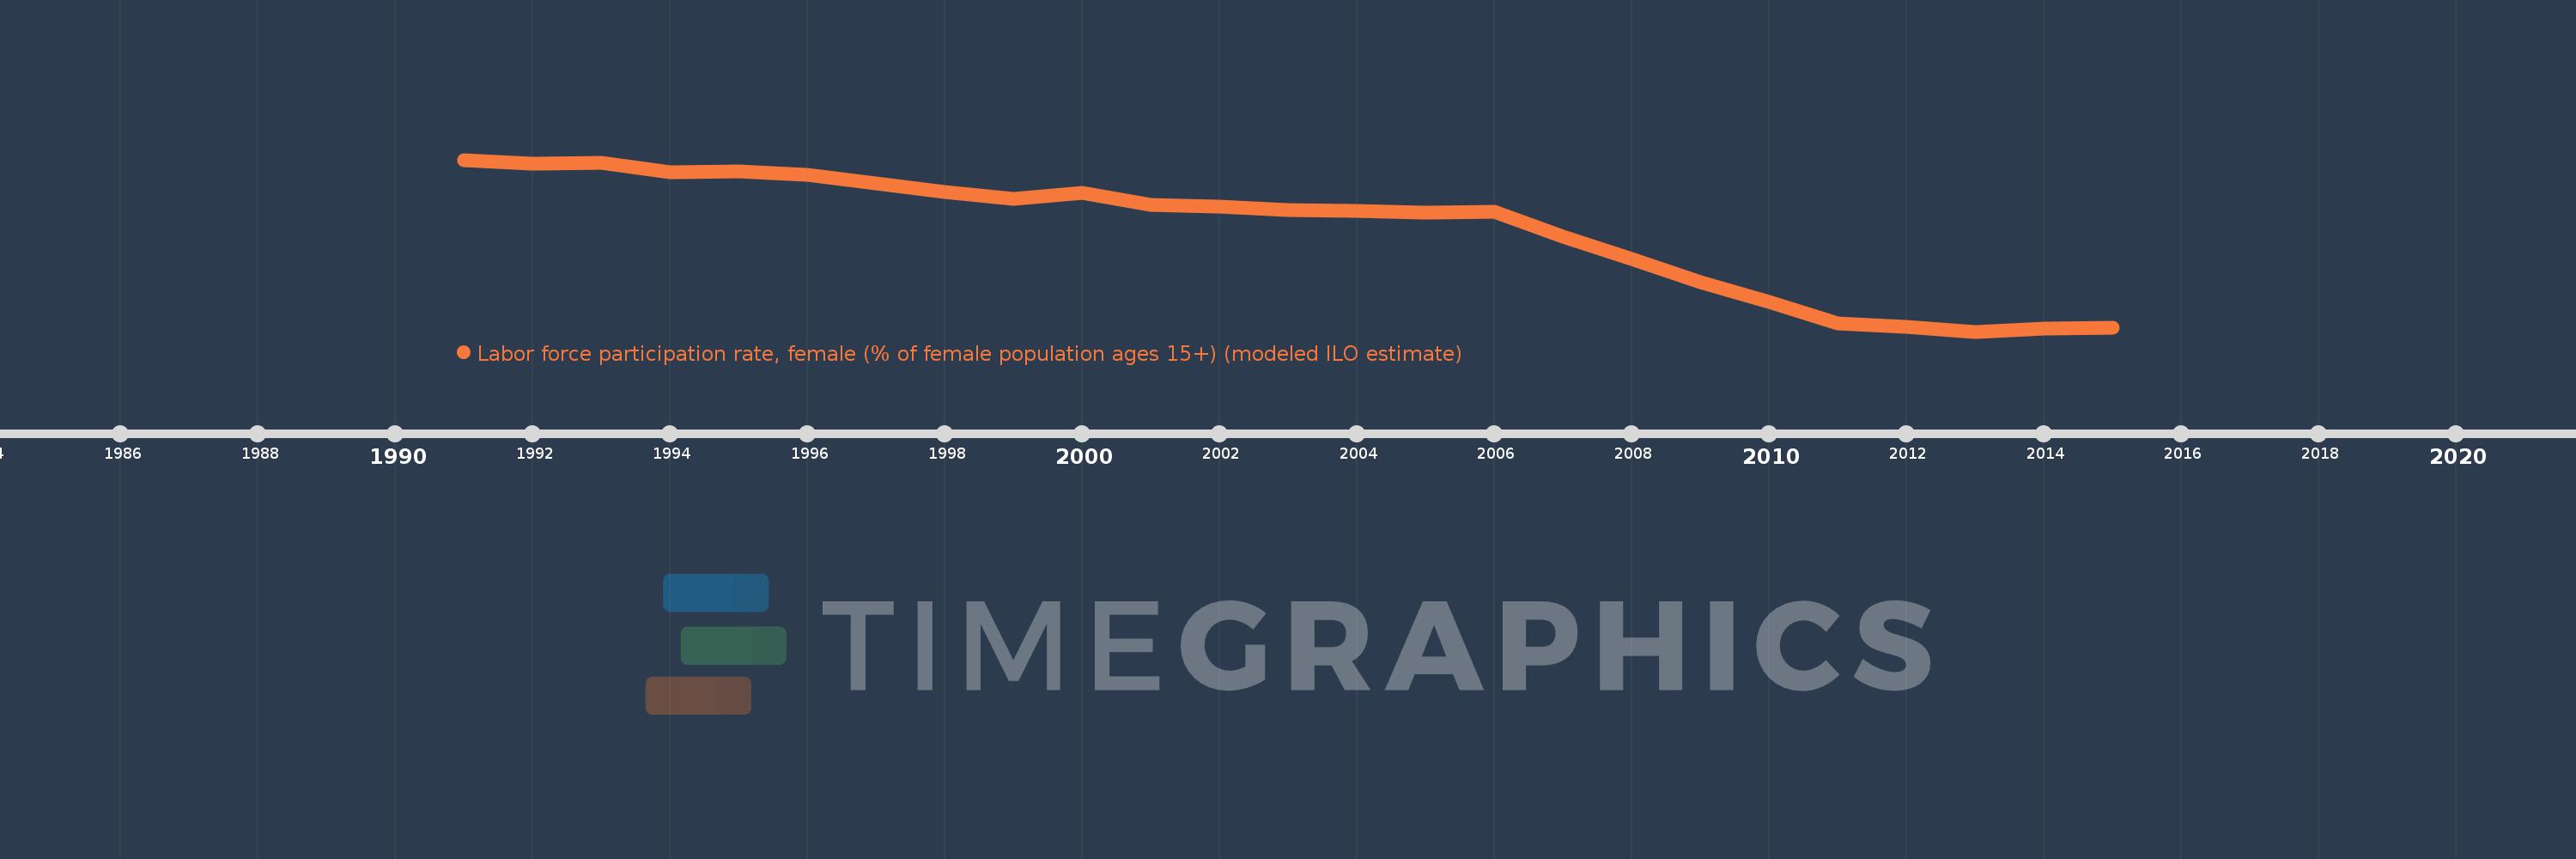
Labor force participation rate, female (% of female population ages 15+) (modeled ILO estimate)
2015,2014,2013,2012,2011,2010,2009,2008,2007,2006,2005,2004,2003,2002,2001,2000,1999,1998,1997,1996,1995,1994,1993,1992,1991
This statistics in other country:
AfghanistanAlbaniaAlgeriaAngolaArab WorldArgentinaArmeniaAustraliaAustriaAzerbaijanBahamas, TheBahrainBangladeshBarbadosBelarusBelgiumBelizeBeninBhutanBoliviaBosnia and HerzegovinaBotswanaBrazilBrunei DarussalamBulgariaBurkina FasoBurundiCabo VerdeCambodiaCameroonCanadaCaribbean small statesCentral African RepublicCentral Europe and the BalticsChadChannel IslandsChileChinaColombiaComorosCongo, Dem. Rep.Congo, Rep.Costa RicaCote d'IvoireCroatiaCubaCyprusCzech RepublicDenmarkDjiboutiDominican RepublicEarly-demographic dividendEast Asia & PacificEast Asia & Pacific (excluding high income)East Asia & Pacific (IDA & IBRD countries)EcuadorEgypt, Arab Rep.El SalvadorEquatorial GuineaEritreaEstoniaEthiopiaEuro areaEurope & Central AsiaEurope & Central Asia (excluding high income)Europe & Central Asia (IDA & IBRD countries)European UnionFijiFinlandFragile and conflict affected situationsFranceFrench PolynesiaGabonGambia, TheGeorgiaGermanyGhanaGreeceGuamGuatemalaGuineaGuinea-BissauGuyanaHaitiHeavily indebted poor countries (HIPC)High incomeHondurasHong Kong SAR, ChinaHungaryIBRD onlyIcelandIDA & IBRD totalIDA blendIDA onlyIDA totalIndiaIndonesiaIran, Islamic Rep.IraqIrelandIsraelItalyJamaicaJapanJordanKazakhstanKenyaKorea, Dem. People’s Rep.Korea, Rep.KuwaitKyrgyz RepublicLao PDRLate-demographic dividendLatin America & Caribbean Latin America & Caribbean (excluding high income)Latin America & the Caribbean (IDA & IBRD countries)LatviaLeast developed countries: UN classificationLebanonLesothoLiberiaLibyaLithuaniaLow & middle incomeLow incomeLower middle incomeLuxembourgMacao SAR, ChinaMacedonia, FYRMadagascarMalawiMalaysiaMaldivesMaliMaltaMauritaniaMauritiusMexicoMiddle East & North AfricaMiddle East & North Africa (excluding high income)Middle East & North Africa (IDA & IBRD countries)Middle incomeMoldovaMongoliaMontenegroMoroccoMozambiqueMyanmarNamibiaNepalNetherlandsNew CaledoniaNew ZealandNicaraguaNigerNigeriaNorth AmericaNorwayOECD membersOmanOther small statesPacific island small statesPakistanPanamaPapua New GuineaParaguayPeruPhilippinesPolandPortugalPost-demographic dividendPre-demographic dividendPuerto RicoQatarRomaniaRussian FederationRwandaSamoaSao Tome and PrincipeSaudi ArabiaSenegalSerbiaSierra LeoneSingaporeSlovak RepublicSloveniaSmall statesSolomon IslandsSomaliaSouth AfricaSouth AsiaSouth Asia (IDA & IBRD)SpainSri LankaSt. LuciaSt. Vincent and the GrenadinesSub-Saharan Africa Sub-Saharan Africa (excluding high income)Sub-Saharan Africa (IDA & IBRD countries)SudanSurinameSwazilandSwedenSwitzerlandSyrian Arab RepublicTajikistanTanzaniaThailandTimor-LesteTogoTongaTrinidad and TobagoTunisiaTurkeyTurkmenistanUgandaUkraineUnited Arab EmiratesUnited KingdomUnited StatesUpper middle incomeUruguayUzbekistanVanuatuVenezuela, RBVietnamVirgin Islands (U.S.)West Bank and GazaWorldYemen, Rep.ZambiaZimbabwe Timeline:
This timeline shows a graph from 1991 to 2015 of Low & middle income. No data until 1990. Number of actual observations by date: 25.
Source name:
World Development Indicators
Source organization:
International Labour Organization, Key Indicators of the Labour Market database.
Categories, topics:
Social Protection & Labor, Gender, Social Development
Last updated:
apr 23, 2017
Indicators value changes by year
Minimum:
49.806
jan 1, 2013
Maximum:
53.161
jan 1, 1991
At the date of observation
Value
Absolute change
Change from previous value
jan 1, 1991
53.161
+53.161
0.0%
jan 1, 1992
53.092
-0.069
-0.13%
jan 1, 1993
53.105
+0.012
0.02%
jan 1, 1994
52.923
-0.182
-0.34%
jan 1, 1995
52.94
+0.017
0.03%
jan 1, 1996
52.872
-0.067
-0.13%
jan 1, 1997
52.699
-0.173
-0.33%
jan 1, 1998
52.534
-0.165
-0.31%
jan 1, 1999
52.399
-0.134
-0.26%
jan 1, 2000
52.512
+0.112
0.21%
jan 1, 2001
52.275
-0.237
-0.45%
jan 1, 2002
52.244
-0.031
-0.06%
jan 1, 2003
52.188
-0.056
-0.11%
jan 1, 2004
52.156
-0.032
-0.06%
jan 1, 2005
52.124
-0.031
-0.06%
jan 1, 2006
52.151
+0.027
0.05%
jan 1, 2007
51.658
-0.492
-0.94%
jan 1, 2008
51.229
-0.429
-0.83%
jan 1, 2009
50.771
-0.458
-0.89%
jan 1, 2010
50.393
-0.378
-0.75%
jan 1, 2011
49.959
-0.433
-0.86%
jan 1, 2012
49.902
-0.057
-0.11%
jan 1, 2013
49.806
-0.096
-0.19%
jan 1, 2014
49.86
+0.053
0.11%
jan 1, 2015
49.886
+0.026
0.05%
Ranking of countries by current statistics by years


Comments: