29
/
en
AIzaSyAYiBZKx7MnpbEhh9jyipgxe19OcubqV5w
April 1, 2024
44548
Least developed countries: UN classification
LDC
false
2
1
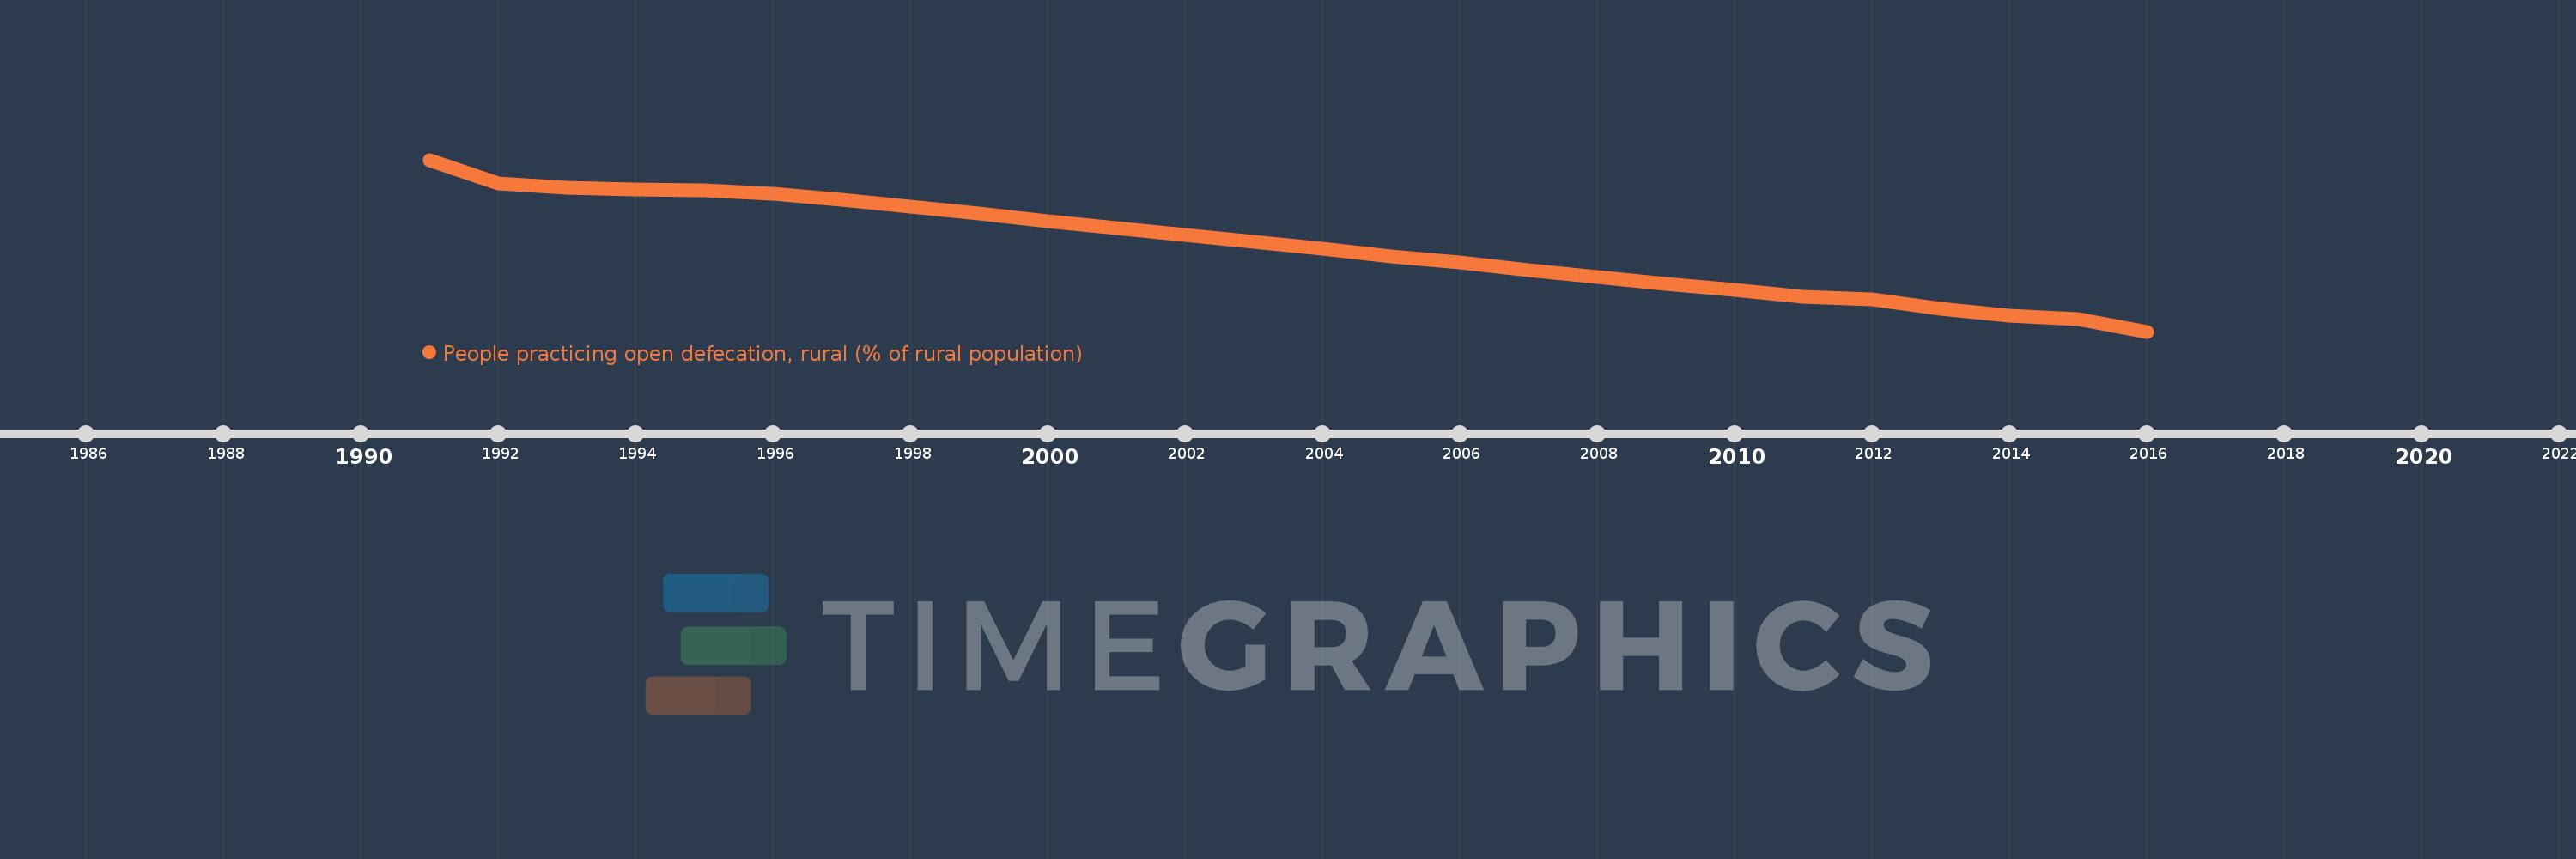
People practicing open defecation, rural (% of rural population)
2016,2015,2014,2013,2012,2011,2010,2009,2008,2007,2006,2005,2004,2003,2002,2001,2000,1999,1998,1997,1996,1995,1994,1993,1992,1991
This statistics in other country:
AfghanistanAlbaniaAlgeriaAmerican SamoaAndorraAngolaAntigua and BarbudaArab WorldArgentinaArmeniaArubaAustraliaAustriaAzerbaijanBahamas, TheBahrainBangladeshBarbadosBelarusBelgiumBelizeBeninBhutanBoliviaBosnia and HerzegovinaBotswanaBrazilBritish Virgin IslandsBulgariaBurkina FasoBurundiCabo VerdeCambodiaCameroonCaribbean small statesCentral African RepublicCentral Europe and the BalticsChadChileChinaColombiaComorosCongo, Dem. Rep.Congo, Rep.Costa RicaCote d'IvoireCroatiaCubaCyprusCzech RepublicDenmarkDjiboutiDominicaDominican RepublicEarly-demographic dividendEast Asia & PacificEast Asia & Pacific (excluding high income)East Asia & Pacific (IDA & IBRD countries)EcuadorEgypt, Arab Rep.El SalvadorEquatorial GuineaEritreaEstoniaEthiopiaEuro areaEurope & Central AsiaEurope & Central Asia (excluding high income)Europe & Central Asia (IDA & IBRD countries)European UnionFijiFinlandFragile and conflict affected situationsFranceFrench PolynesiaGabonGambia, TheGeorgiaGermanyGhanaGreeceGreenlandGrenadaGuamGuatemalaGuineaGuinea-BissauGuyanaHaitiHeavily indebted poor countries (HIPC)High incomeHondurasHungaryIBRD onlyIcelandIDA & IBRD totalIDA blendIDA onlyIDA totalIndiaIndonesiaIran, Islamic Rep.IraqIsraelItalyJamaicaJapanJordanKazakhstanKenyaKiribatiKorea, Dem. People’s Rep.Korea, Rep.KuwaitKyrgyz RepublicLao PDRLate-demographic dividendLatin America & Caribbean Latin America & Caribbean (excluding high income)Latin America & the Caribbean (IDA & IBRD countries)LatviaLeast developed countries: UN classificationLebanonLesothoLiberiaLow & middle incomeLow incomeLower middle incomeLuxembourgMacedonia, FYRMadagascarMalawiMalaysiaMaldivesMaliMaltaMarshall IslandsMauritaniaMauritiusMexicoMicronesia, Fed. Sts.Middle East & North AfricaMiddle East & North Africa (excluding high income)Middle East & North Africa (IDA & IBRD countries)Middle incomeMoldovaMongoliaMontenegroMoroccoMozambiqueMyanmarNamibiaNepalNetherlandsNew CaledoniaNicaraguaNigerNigeriaNorth AmericaNorthern Mariana IslandsNorwayOECD membersOmanOther small statesPacific island small statesPakistanPalauPanamaPapua New GuineaParaguayPeruPhilippinesPolandPortugalPost-demographic dividendPre-demographic dividendPuerto RicoRussian FederationRwandaSamoaSao Tome and PrincipeSaudi ArabiaSenegalSerbiaSeychellesSierra LeoneSlovak RepublicSloveniaSmall statesSolomon IslandsSomaliaSouth AfricaSouth AsiaSouth Asia (IDA & IBRD)South SudanSpainSri LankaSt. Kitts and NevisSt. LuciaSt. Vincent and the GrenadinesSub-Saharan Africa Sub-Saharan Africa (excluding high income)Sub-Saharan Africa (IDA & IBRD countries)SudanSurinameSwazilandSwedenSwitzerlandSyrian Arab RepublicTajikistanTanzaniaThailandTimor-LesteTogoTrinidad and TobagoTunisiaTurkeyTurkmenistanTurks and Caicos IslandsTuvaluUgandaUkraineUnited Arab EmiratesUnited KingdomUnited StatesUpper middle incomeUruguayUzbekistanVanuatuVenezuela, RBVietnamWest Bank and GazaWorldYemen, Rep.ZambiaZimbabwe Timeline:
This timeline shows a graph from 1991 to 2016 of Least developed countries: UN classification. No data until 1990. Number of actual observations by date: 26.
Source name:
World Development Indicators
Source organization:
WHO/UNICEF Joint Monitoring Programme (JMP) for Water Supply and Sanitation (http://www.wssinfo.org/).
Categories, topics:
Health
Last updated:
apr 23, 2017
Indicators value changes by year
Minimum:
27.078
jan 1, 2016
Maximum:
53.612
jan 1, 1991
At the date of observation
Value
Absolute change
Change from previous value
jan 1, 1991
53.612
+53.612
0.0%
jan 1, 1992
49.935
-3.676
-6.86%
jan 1, 1993
49.366
-0.57
-1.14%
jan 1, 1994
49.072
-0.294
-0.59%
jan 1, 1995
48.883
-0.189
-0.38%
jan 1, 1996
48.329
-0.554
-1.13%
jan 1, 1997
47.45
-0.879
-1.82%
jan 1, 1998
46.362
-1.088
-2.29%
jan 1, 1999
45.272
-1.09
-2.35%
jan 1, 2000
44.184
-1.088
-2.4%
jan 1, 2001
43.073
-1.111
-2.51%
jan 1, 2002
41.985
-1.088
-2.53%
jan 1, 2003
40.892
-1.094
-2.6%
jan 1, 2004
39.836
-1.056
-2.58%
jan 1, 2005
38.748
-1.088
-2.73%
jan 1, 2006
37.692
-1.056
-2.73%
jan 1, 2007
36.619
-1.073
-2.85%
jan 1, 2008
35.559
-1.06
-2.9%
jan 1, 2009
34.506
-1.053
-2.96%
jan 1, 2010
33.456
-1.05
-3.04%
jan 1, 2011
32.438
-1.018
-3.04%
jan 1, 2012
32.059
-0.379
-1.17%
jan 1, 2013
30.531
-1.528
-4.77%
jan 1, 2014
29.522
-1.009
-3.3%
jan 1, 2015
28.938
-0.585
-1.98%
jan 1, 2016
27.078
-1.859
-6.42%
Ranking of countries by current statistics by years


Comments: