29
/
en
AIzaSyAYiBZKx7MnpbEhh9jyipgxe19OcubqV5w
April 1, 2024
44146
Least developed countries: UN classification
LDC
false
2
1
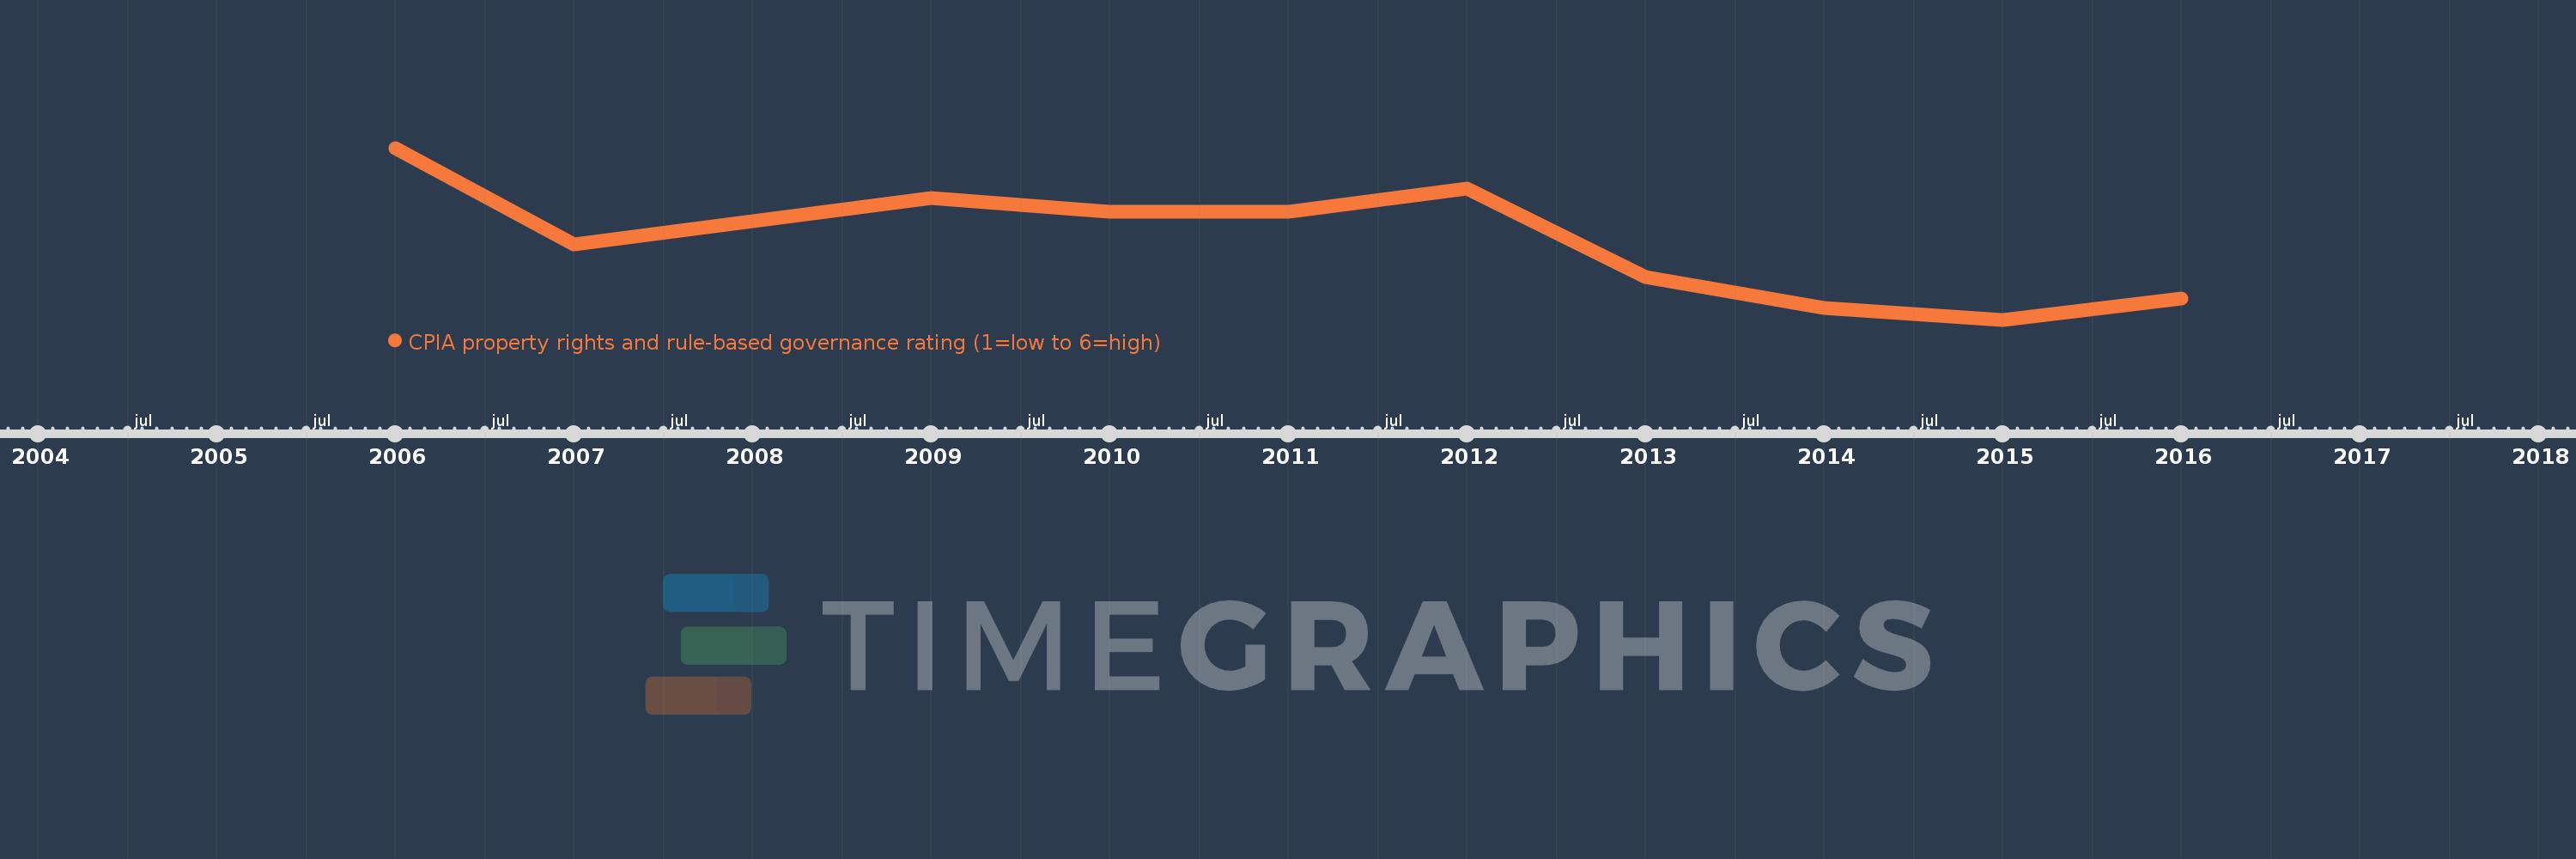
CPIA property rights and rule-based governance rating (1=low to 6=high)
2016,2015,2014,2013,2012,2011,2010,2009,2008,2007,2006
This statistics in other country:
Timeline:
This timeline shows a graph from 2006 to 2016 of Least developed countries: UN classification. No data until 2005. Number of actual observations by date: 11.
Source name:
World Development Indicators
Source organization:
World Bank Group, CPIA database (http://www.worldbank.org/ida).
Categories, topics:
Public Sector
Last updated:
apr 23, 2017
Indicators value changes by year
At the date of observation
Value
Absolute change
Change from previous value
jan 1, 2007
2.75
-0.05
-1.79%
jan 1, 2008
2.762
+0.012
0.43%
jan 1, 2009
2.774
+0.012
0.43%
jan 1, 2010
2.767
-0.006
-0.23%
jan 1, 2011
2.767
0.0
0.0%
jan 1, 2012
2.779
+0.012
0.42%
jan 1, 2013
2.733
-0.046
-1.65%
jan 1, 2014
2.717
-0.016
-0.58%
jan 1, 2015
2.711
-0.006
-0.23%
jan 1, 2016
2.722
+0.011
0.41%
Ranking of countries by current statistics by years


Comments: