29
/
en
AIzaSyAYiBZKx7MnpbEhh9jyipgxe19OcubqV5w
April 1, 2024
44139
Least developed countries: UN classification
LDC
false
2
1
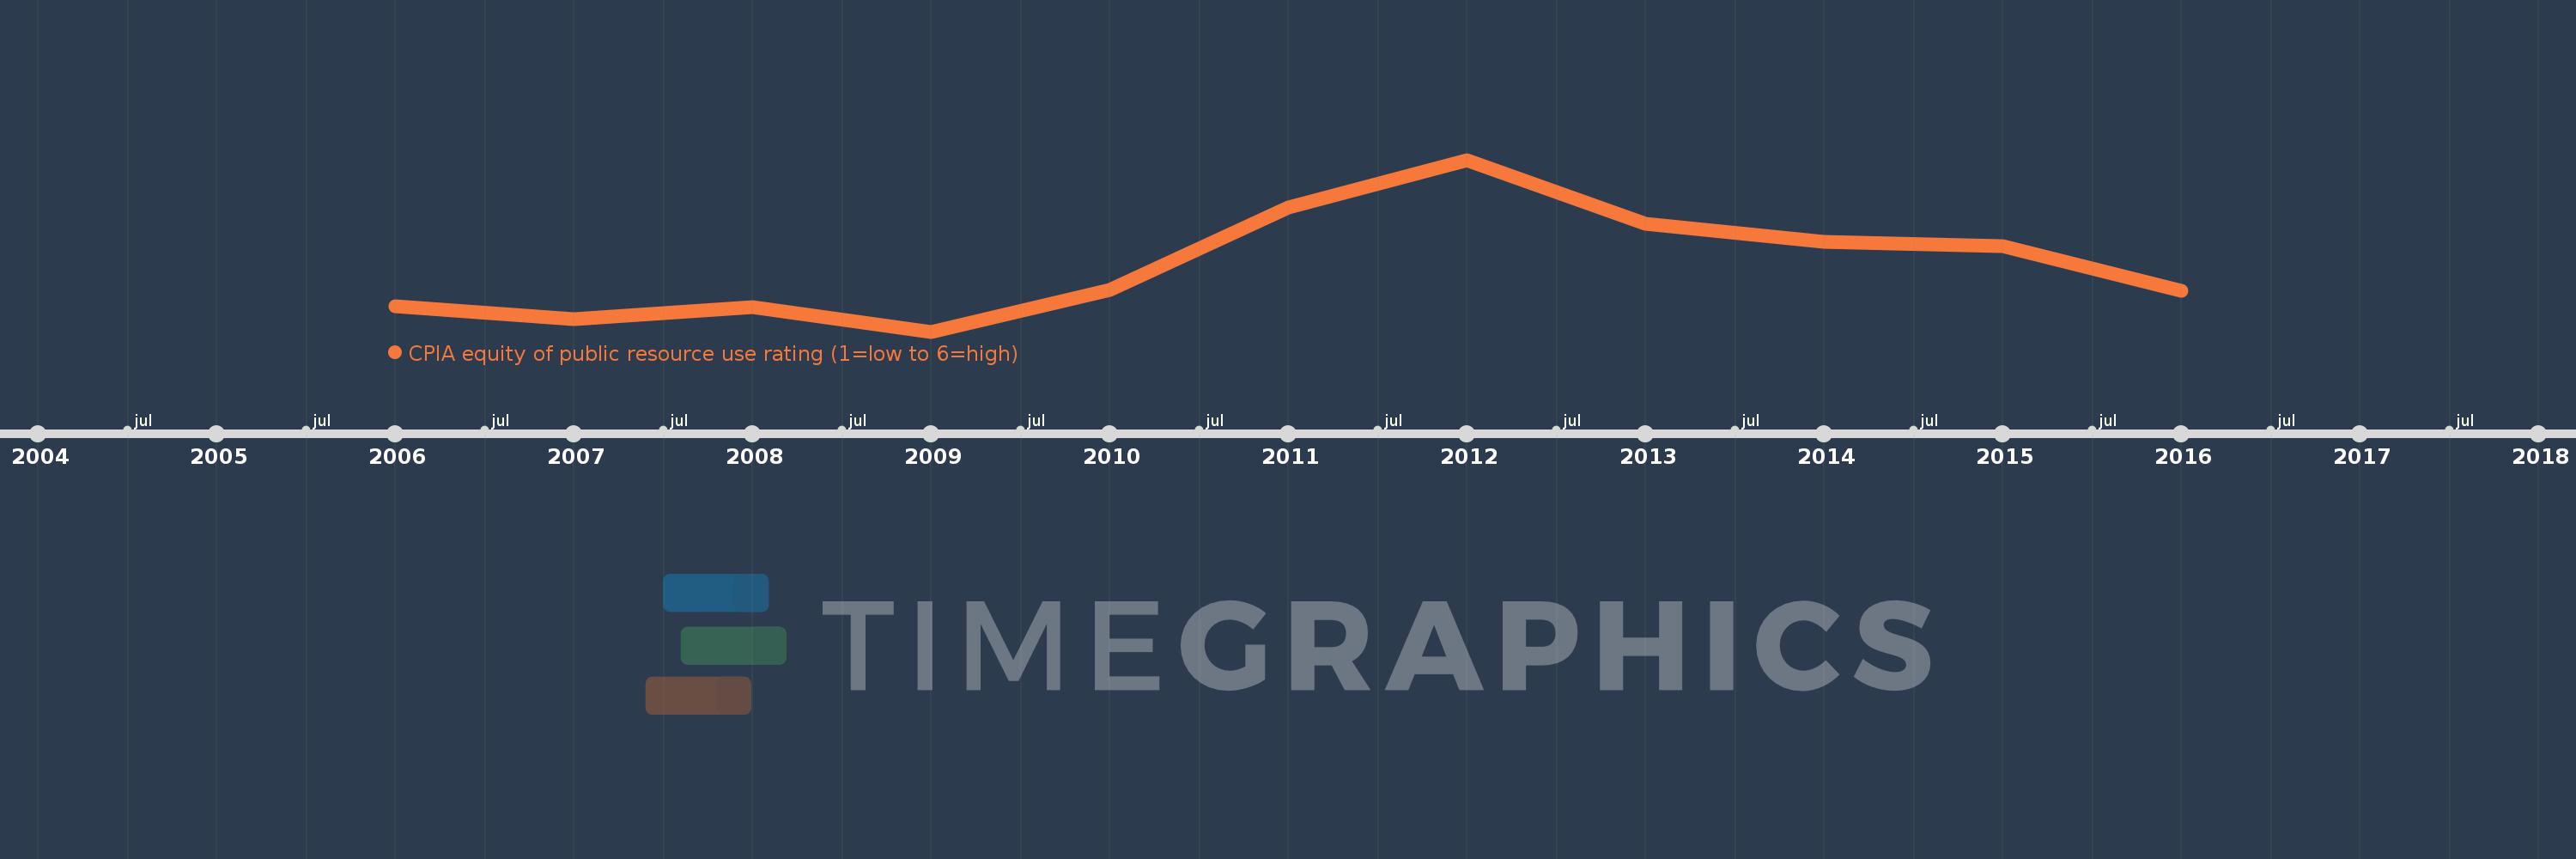
CPIA equity of public resource use rating (1=low to 6=high)
2016,2015,2014,2013,2012,2011,2010,2009,2008,2007,2006
This statistics in other country:
Timeline:
This timeline shows a graph from 2006 to 2016 of Least developed countries: UN classification. No data until 2005. Number of actual observations by date: 11.
Source name:
World Development Indicators
Source organization:
World Bank Group, CPIA database (http://www.worldbank.org/ida).
Categories, topics:
Public Sector
Last updated:
apr 23, 2017
Indicators value changes by year
At the date of observation
Value
Absolute change
Change from previous value
jan 1, 2006
3.263
+3.263
0.0%
jan 1, 2007
3.25
-0.013
-0.38%
jan 1, 2008
3.262
+0.012
0.37%
jan 1, 2009
3.238
-0.024
-0.73%
jan 1, 2010
3.279
+0.041
1.27%
jan 1, 2011
3.36
+0.081
2.48%
jan 1, 2012
3.407
+0.047
1.38%
jan 1, 2013
3.344
-0.063
-1.84%
jan 1, 2014
3.326
-0.018
-0.55%
jan 1, 2015
3.322
-0.004
-0.12%
jan 1, 2016
3.278
-0.044
-1.34%
Ranking of countries by current statistics by years


Comments: