29
/
en
AIzaSyAYiBZKx7MnpbEhh9jyipgxe19OcubqV5w
April 1, 2024
43670
Latin America & the Caribbean (IDA & IBRD countries)
TLA
false
2
1
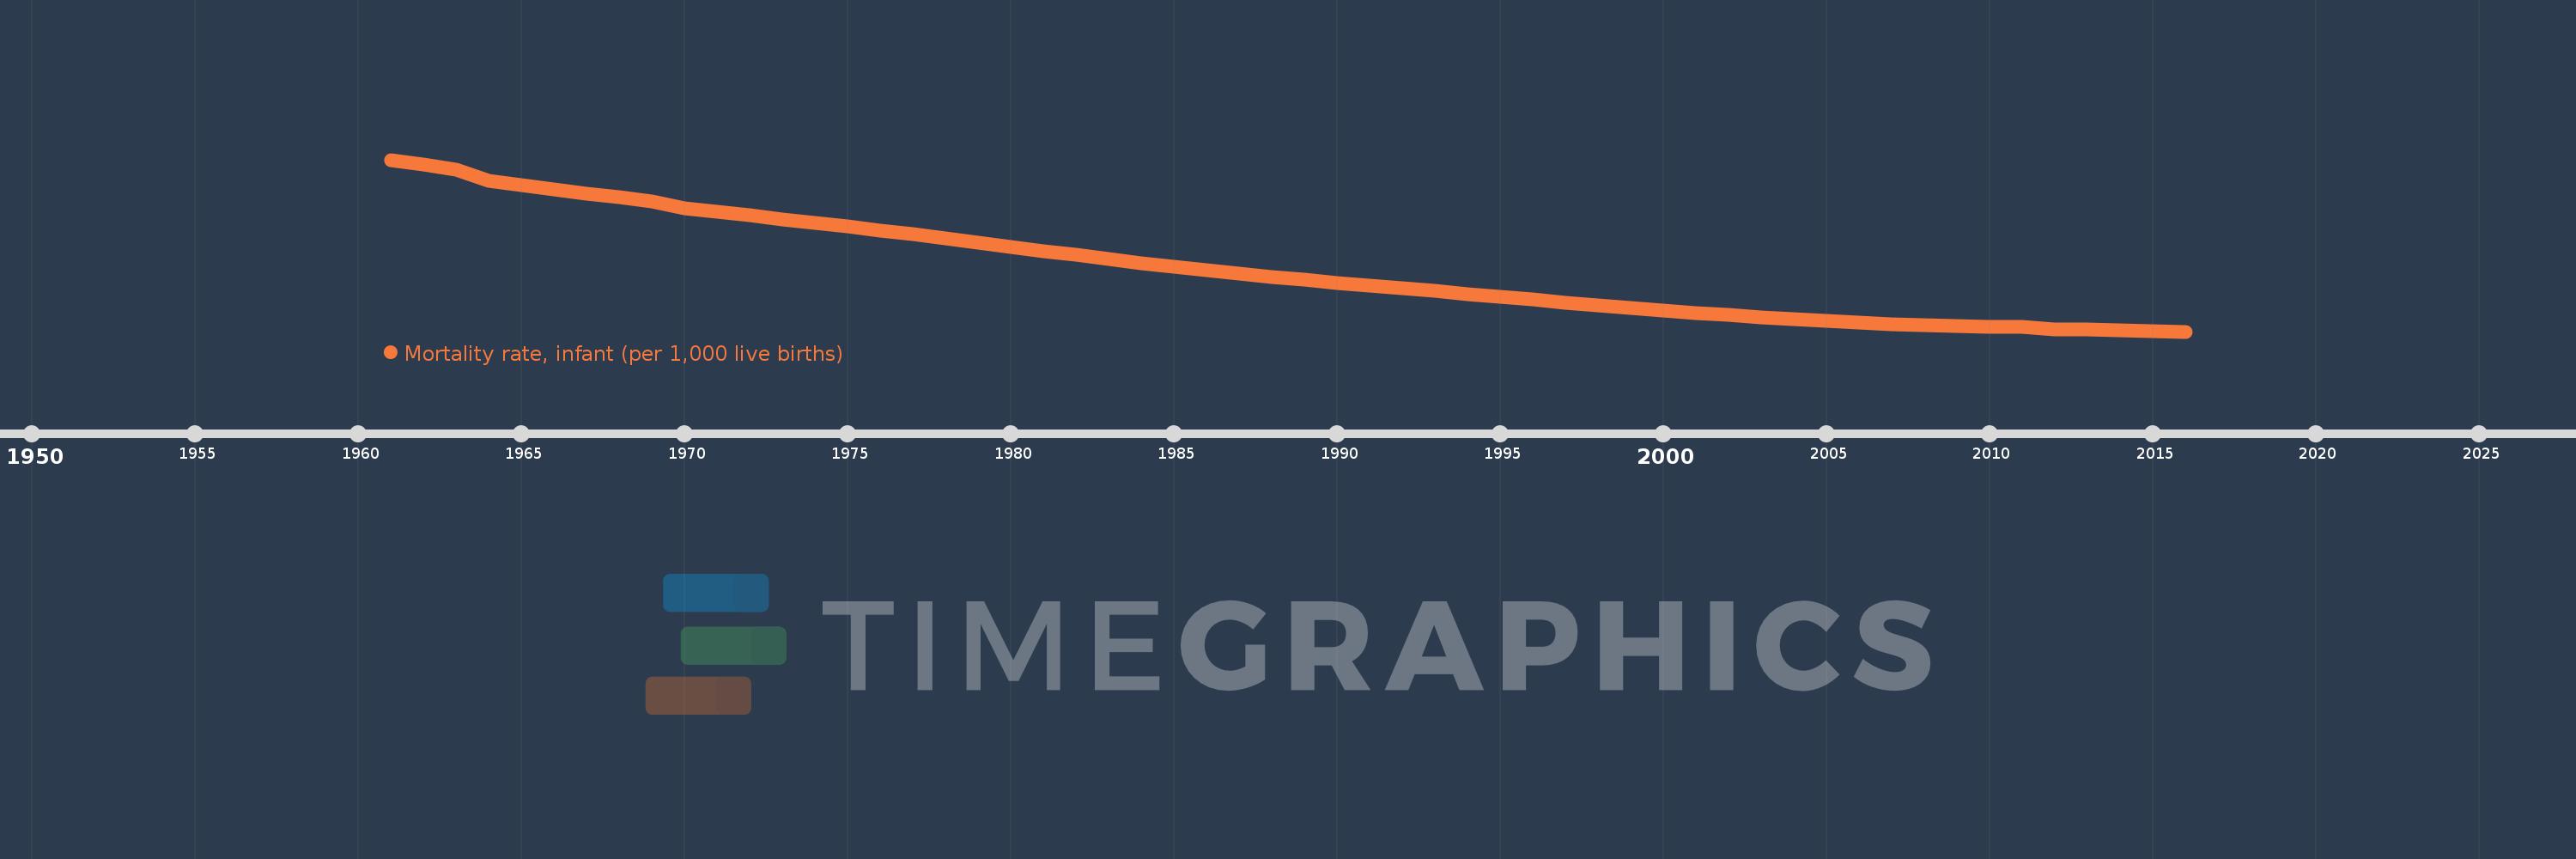
Mortality rate, infant (per 1,000 live births)
2016,2015,2014,2013,2012,2011,2010,2009,2008,2007,2006,2005,2004,2003,2002,2001,2000,1999,1998,1997,1996,1995,1994,1993,1992,1991,1990,1989,1988,1987,1986,1985,1984,1983,1982,1981,1980,1979,1978,1977,1976,1975,1974,1973,1972,1971,1970,1969,1968,1967,1966,1965,1964,1963,1962,1961
This statistics in other country:
AfghanistanAlbaniaAlgeriaAndorraAngolaAntigua and BarbudaArab WorldArgentinaArmeniaAustraliaAustriaAzerbaijanBahamas, TheBahrainBangladeshBarbadosBelarusBelgiumBelizeBeninBhutanBoliviaBosnia and HerzegovinaBotswanaBrazilBrunei DarussalamBulgariaBurkina FasoBurundiCabo VerdeCambodiaCameroonCanadaCaribbean small statesCentral African RepublicCentral Europe and the BalticsChadChileChinaColombiaComorosCongo, Dem. Rep.Congo, Rep.Costa RicaCote d'IvoireCroatiaCubaCyprusCzech RepublicDenmarkDjiboutiDominicaDominican RepublicEarly-demographic dividendEast Asia & PacificEast Asia & Pacific (excluding high income)East Asia & Pacific (IDA & IBRD countries)EcuadorEgypt, Arab Rep.El SalvadorEquatorial GuineaEritreaEstoniaEthiopiaEuro areaEurope & Central AsiaEurope & Central Asia (excluding high income)Europe & Central Asia (IDA & IBRD countries)European UnionFijiFinlandFragile and conflict affected situationsFranceGabonGambia, TheGeorgiaGermanyGhanaGreeceGrenadaGuatemalaGuineaGuinea-BissauGuyanaHaitiHeavily indebted poor countries (HIPC)High incomeHondurasHungaryIBRD onlyIcelandIDA & IBRD totalIDA blendIDA onlyIDA totalIndiaIndonesiaIran, Islamic Rep.IraqIrelandIsraelItalyJamaicaJapanJordanKazakhstanKenyaKiribatiKorea, Dem. People’s Rep.Korea, Rep.KuwaitKyrgyz RepublicLao PDRLate-demographic dividendLatin America & Caribbean Latin America & Caribbean (excluding high income)Latin America & the Caribbean (IDA & IBRD countries)LatviaLeast developed countries: UN classificationLebanonLesothoLiberiaLibyaLithuaniaLow & middle incomeLow incomeLower middle incomeLuxembourgMacedonia, FYRMadagascarMalawiMalaysiaMaldivesMaliMaltaMarshall IslandsMauritaniaMauritiusMexicoMicronesia, Fed. Sts.Middle East & North AfricaMiddle East & North Africa (excluding high income)Middle East & North Africa (IDA & IBRD countries)Middle incomeMoldovaMonacoMongoliaMontenegroMoroccoMozambiqueMyanmarNamibiaNauruNepalNetherlandsNew ZealandNicaraguaNigerNigeriaNorth AmericaNorwayOECD membersOmanOther small statesPacific island small statesPakistanPalauPanamaPapua New GuineaParaguayPeruPhilippinesPolandPortugalPost-demographic dividendPre-demographic dividendQatarRomaniaRussian FederationRwandaSamoaSan MarinoSao Tome and PrincipeSaudi ArabiaSenegalSerbiaSeychellesSierra LeoneSingaporeSlovak RepublicSloveniaSmall statesSolomon IslandsSomaliaSouth AfricaSouth AsiaSouth Asia (IDA & IBRD)South SudanSpainSri LankaSt. Kitts and NevisSt. LuciaSt. Vincent and the GrenadinesSub-Saharan Africa Sub-Saharan Africa (excluding high income)Sub-Saharan Africa (IDA & IBRD countries)SudanSurinameSwazilandSwedenSwitzerlandSyrian Arab RepublicTajikistanTanzaniaThailandTimor-LesteTogoTongaTrinidad and TobagoTunisiaTurkeyTurkmenistanTuvaluUgandaUkraineUnited Arab EmiratesUnited KingdomUnited StatesUpper middle incomeUruguayUzbekistanVanuatuVenezuela, RBVietnamWest Bank and GazaWorldYemen, Rep.ZambiaZimbabwe Timeline:
This timeline shows a graph from 1961 to 2016 of Latin America & the Caribbean (IDA & IBRD countries). No data until 1960. Number of actual observations by date: 56.
Source name:
World Development Indicators
Source organization:
Estimates Developed by the UN Inter-agency Group for Child Mortality Estimation (UNICEF, WHO, World Bank, UN DESA Population Division) at www.childmortality.org. Projected data are from the United Nations Population Division's World Population Prospects; and may in some cases not be consistent with data before the current year.
Categories, topics:
Health
Last updated:
apr 23, 2017
Indicators value changes by year
Minimum:
15.347
jan 1, 2016
Maximum:
120.587
jan 1, 1961
At the date of observation
Value
Absolute change
Change from previous value
jan 1, 1961
120.587
+120.587
0.0%
jan 1, 1962
117.556
-3.031
-2.51%
jan 1, 1963
114.689
-2.867
-2.44%
jan 1, 1964
107.449
-7.24
-6.31%
jan 1, 1965
104.961
-2.488
-2.32%
jan 1, 1966
102.219
-2.743
-2.61%
jan 1, 1967
99.816
-2.403
-2.35%
jan 1, 1968
97.436
-2.38
-2.38%
jan 1, 1969
95.054
-2.382
-2.44%
jan 1, 1970
90.995
-4.058
-4.27%
jan 1, 1971
88.772
-2.223
-2.44%
jan 1, 1972
86.534
-2.238
-2.52%
jan 1, 1973
84.241
-2.292
-2.65%
jan 1, 1974
81.973
-2.269
-2.69%
jan 1, 1975
79.661
-2.312
-2.82%
jan 1, 1976
77.347
-2.314
-2.9%
jan 1, 1977
74.956
-2.391
-3.09%
jan 1, 1978
72.483
-2.473
-3.3%
jan 1, 1979
69.975
-2.508
-3.46%
jan 1, 1980
67.388
-2.587
-3.7%
jan 1, 1981
64.785
-2.602
-3.86%
jan 1, 1982
62.181
-2.604
-4.02%
jan 1, 1983
59.697
-2.485
-4.0%
jan 1, 1984
57.248
-2.449
-4.1%
jan 1, 1985
55.004
-2.244
-3.92%
jan 1, 1986
52.847
-2.157
-3.92%
jan 1, 1987
50.805
-2.042
-3.86%
jan 1, 1988
48.866
-1.94
-3.82%
jan 1, 1989
47.052
-1.813
-3.71%
jan 1, 1990
45.26
-1.792
-3.81%
jan 1, 1991
43.533
-1.727
-3.82%
jan 1, 1992
41.823
-1.71
-3.93%
jan 1, 1993
40.111
-1.712
-4.09%
jan 1, 1994
38.402
-1.708
-4.26%
jan 1, 1995
36.674
-1.729
-4.5%
jan 1, 1996
34.928
-1.746
-4.76%
jan 1, 1997
33.221
-1.707
-4.89%
jan 1, 1998
31.543
-1.677
-5.05%
jan 1, 1999
29.968
-1.575
-4.99%
jan 1, 2000
28.376
-1.592
-5.31%
jan 1, 2001
26.851
-1.525
-5.38%
jan 1, 2002
25.475
-1.376
-5.12%
jan 1, 2003
24.2
-1.275
-5.0%
jan 1, 2004
22.974
-1.227
-5.07%
jan 1, 2005
21.928
-1.046
-4.55%
jan 1, 2006
20.93
-0.997
-4.55%
jan 1, 2007
20.051
-0.879
-4.2%
jan 1, 2008
19.297
-0.754
-3.76%
jan 1, 2009
18.637
-0.66
-3.42%
jan 1, 2010
18.025
-0.612
-3.28%
jan 1, 2011
18.097
+0.073
0.4%
jan 1, 2012
16.914
-1.183
-6.54%
jan 1, 2013
16.447
-0.467
-2.76%
jan 1, 2014
16.047
-0.401
-2.44%
jan 1, 2015
15.686
-0.361
-2.25%
jan 1, 2016
15.347
-0.34
-2.16%
Ranking of countries by current statistics by years


Comments: