29
/
en
AIzaSyAYiBZKx7MnpbEhh9jyipgxe19OcubqV5w
April 1, 2024
43176
Latin America & the Caribbean (IDA & IBRD countries)
TLA
false
2
1
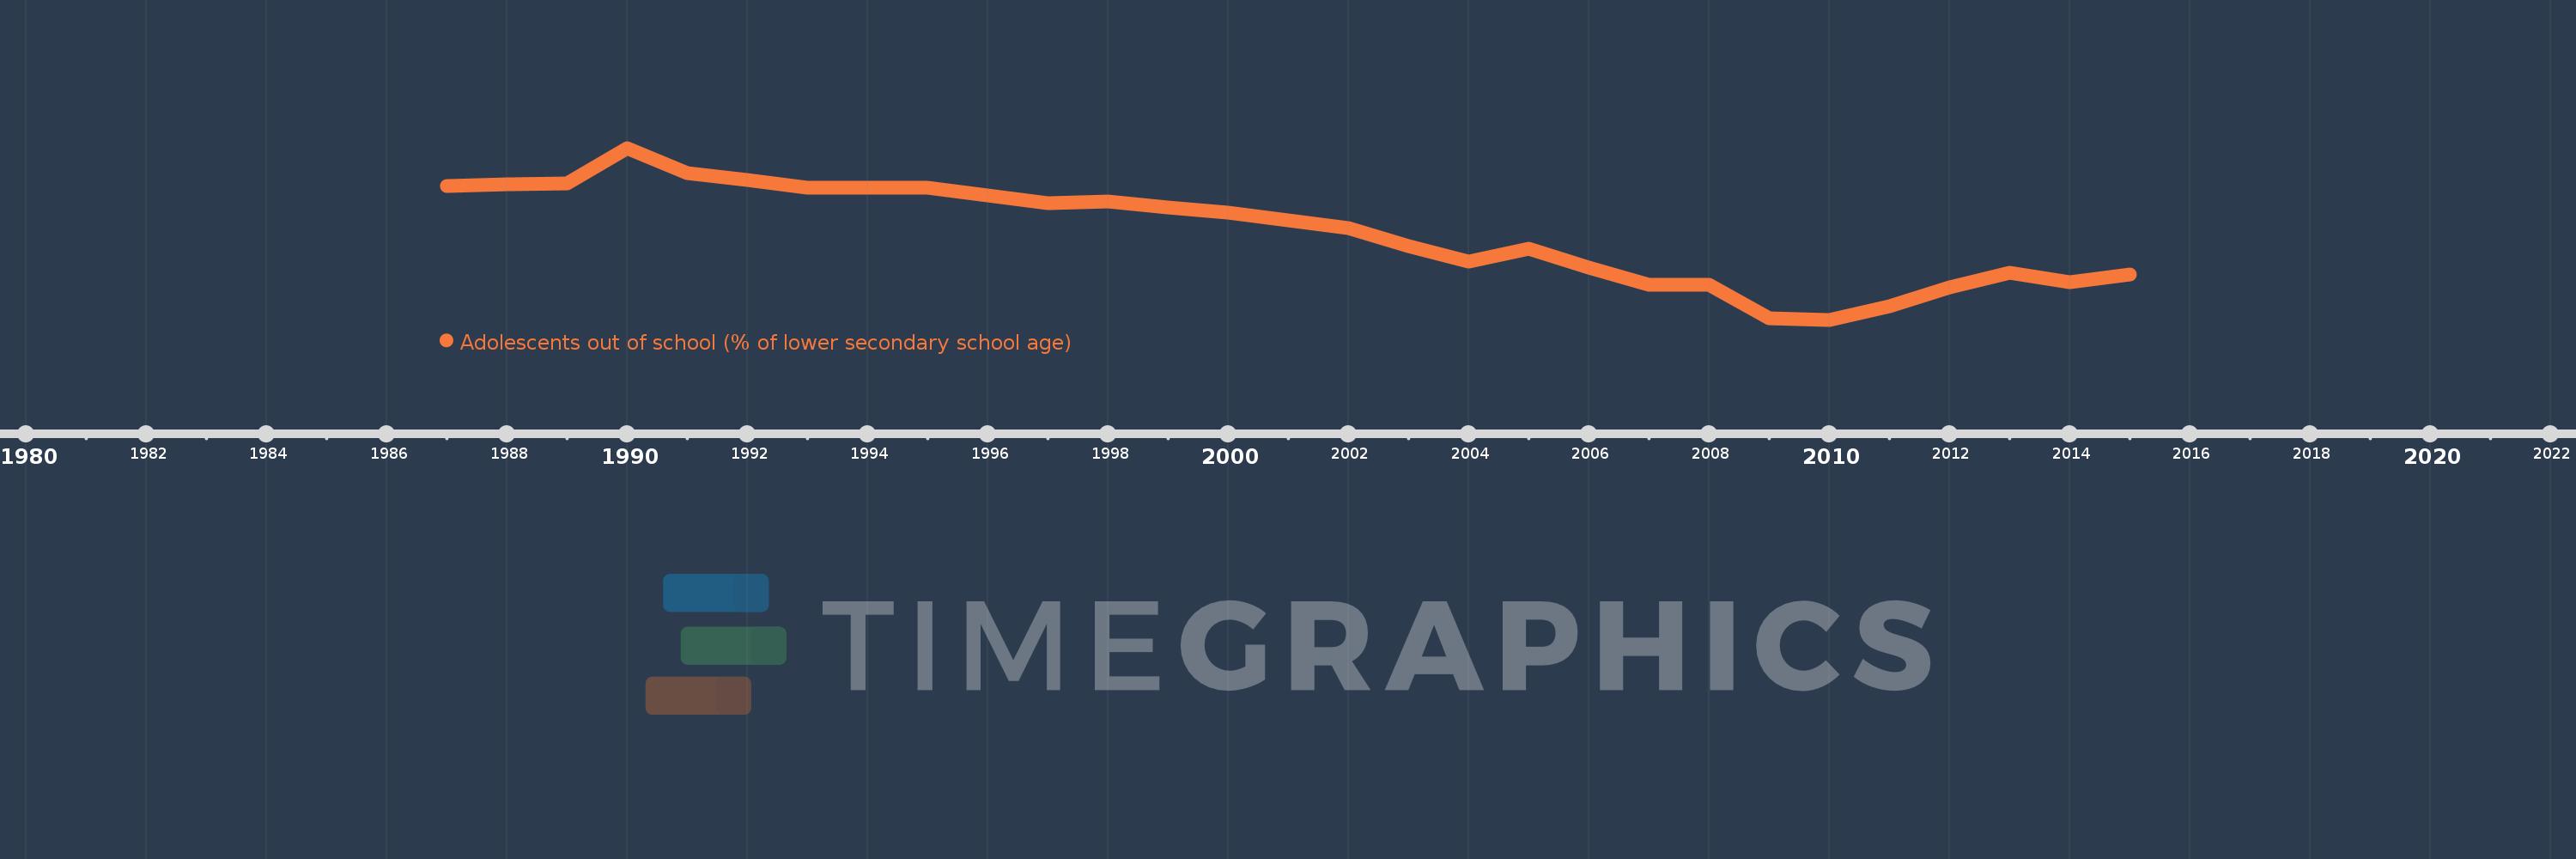
Adolescents out of school (% of lower secondary school age)
2015,2014,2013,2012,2011,2010,2009,2008,2007,2006,2005,2004,2003,2002,2001,2000,1999,1998,1997,1996,1995,1994,1993,1992,1991,1990,1989,1988,1987
This statistics in other country:
AfghanistanAlbaniaAlgeriaAngolaAntigua and BarbudaArab WorldArgentinaArmeniaArubaAustraliaAustriaAzerbaijanBahamas, TheBahrainBangladeshBarbadosBelarusBelgiumBelizeBeninBermudaBhutanBoliviaBotswanaBrazilBrunei DarussalamBulgariaBurkina FasoBurundiCabo VerdeCambodiaCameroonCanadaCaribbean small statesCentral African RepublicCentral Europe and the BalticsChadChileColombiaComorosCongo, Dem. Rep.Congo, Rep.Costa RicaCroatiaCubaCyprusDenmarkDjiboutiDominicaDominican RepublicEarly-demographic dividendEast Asia & PacificEast Asia & Pacific (excluding high income)East Asia & Pacific (IDA & IBRD countries)EcuadorEgypt, Arab Rep.El SalvadorEquatorial GuineaEritreaEstoniaEthiopiaEuro areaEurope & Central AsiaEurope & Central Asia (excluding high income)Europe & Central Asia (IDA & IBRD countries)European UnionFijiFinlandFragile and conflict affected situationsFranceGambia, TheGeorgiaGhanaGreeceGrenadaGuatemalaGuineaGuinea-BissauGuyanaHeavily indebted poor countries (HIPC)High incomeHondurasHong Kong SAR, ChinaHungaryIBRD onlyIcelandIDA & IBRD totalIDA blendIDA onlyIDA totalIndiaIndonesiaIran, Islamic Rep.IraqIrelandIsraelItalyJamaicaJapanJordanKazakhstanKenyaKiribatiKorea, Dem. People’s Rep.Korea, Rep.KuwaitKyrgyz RepublicLao PDRLate-demographic dividendLatin America & Caribbean Latin America & Caribbean (excluding high income)Latin America & the Caribbean (IDA & IBRD countries)LatviaLeast developed countries: UN classificationLebanonLesothoLibyaLiechtensteinLithuaniaLow & middle incomeLow incomeLower middle incomeLuxembourgMacao SAR, ChinaMacedonia, FYRMadagascarMalawiMalaysiaMaldivesMaliMaltaMarshall IslandsMauritaniaMauritiusMexicoMiddle East & North AfricaMiddle East & North Africa (excluding high income)Middle East & North Africa (IDA & IBRD countries)Middle incomeMoldovaMongoliaMoroccoMozambiqueMyanmarNamibiaNauruNetherlandsNew ZealandNicaraguaNigerNorth AmericaNorwayOECD membersOmanOther small statesPacific island small statesPakistanPanamaParaguayPeruPhilippinesPolandPortugalPost-demographic dividendPre-demographic dividendPuerto RicoQatarRomaniaRussian FederationSamoaSao Tome and PrincipeSaudi ArabiaSenegalSerbiaSeychellesSierra LeoneSloveniaSmall statesSolomon IslandsSomaliaSouth AfricaSouth AsiaSouth Asia (IDA & IBRD)SpainSri LankaSt. Kitts and NevisSt. LuciaSt. Vincent and the GrenadinesSub-Saharan Africa Sub-Saharan Africa (excluding high income)Sub-Saharan Africa (IDA & IBRD countries)SudanSurinameSwazilandSwedenSwitzerlandSyrian Arab RepublicTajikistanThailandTimor-LesteTogoTongaTrinidad and TobagoTunisiaTurkeyTuvaluUgandaUkraineUnited Arab EmiratesUnited KingdomUnited StatesUpper middle incomeUruguayUzbekistanVanuatuVenezuela, RBVietnamWest Bank and GazaWorldYemen, Rep.Zimbabwe Timeline:
This timeline shows a graph from 1987 to 2015 of Latin America & the Caribbean (IDA & IBRD countries). No data until 1986. Number of actual observations by date: 29.
Source name:
World Development Indicators
Source organization:
United Nations Educational, Scientific, and Cultural Organization (UNESCO) Institute for Statistics.
Categories, topics:
Education
Last updated:
apr 23, 2017
Indicators value changes by year
Maximum:
13.965
jan 1, 1990
At the date of observation
Value
Absolute change
Change from previous value
jan 1, 1987
12.082
+12.082
0.0%
jan 1, 1988
12.17
+0.088
0.73%
jan 1, 1989
12.233
+0.064
0.52%
jan 1, 1990
13.965
+1.732
14.16%
jan 1, 1991
12.714
-1.251
-8.96%
jan 1, 1992
12.386
-0.329
-2.59%
jan 1, 1993
12.018
-0.368
-2.97%
jan 1, 1994
11.996
-0.022
-0.18%
jan 1, 1995
12.007
+0.011
0.09%
jan 1, 1996
11.635
-0.372
-3.1%
jan 1, 1997
11.246
-0.389
-3.34%
jan 1, 1998
11.312
+0.066
0.59%
jan 1, 1999
11.024
-0.288
-2.54%
jan 1, 2000
10.795
-0.229
-2.08%
jan 1, 2001
10.404
-0.391
-3.62%
jan 1, 2002
10.017
-0.387
-3.72%
jan 1, 2003
9.109
-0.908
-9.06%
jan 1, 2004
8.369
-0.74
-8.13%
jan 1, 2005
9.004
+0.635
7.59%
jan 1, 2006
8.069
-0.935
-10.38%
jan 1, 2007
7.213
-0.856
-10.61%
jan 1, 2008
7.207
-0.006
-0.08%
jan 1, 2009
5.58
-1.628
-22.58%
jan 1, 2010
5.493
-0.086
-1.55%
jan 1, 2011
6.138
+0.645
11.74%
jan 1, 2012
7.085
+0.947
15.42%
jan 1, 2013
7.82
+0.735
10.37%
jan 1, 2014
7.356
-0.464
-5.93%
jan 1, 2015
7.718
+0.363
4.93%
Ranking of countries by current statistics by years


Comments: