29
/
en
AIzaSyAYiBZKx7MnpbEhh9jyipgxe19OcubqV5w
April 1, 2024
43155
Latin America & the Caribbean (IDA & IBRD countries)
TLA
false
2
1
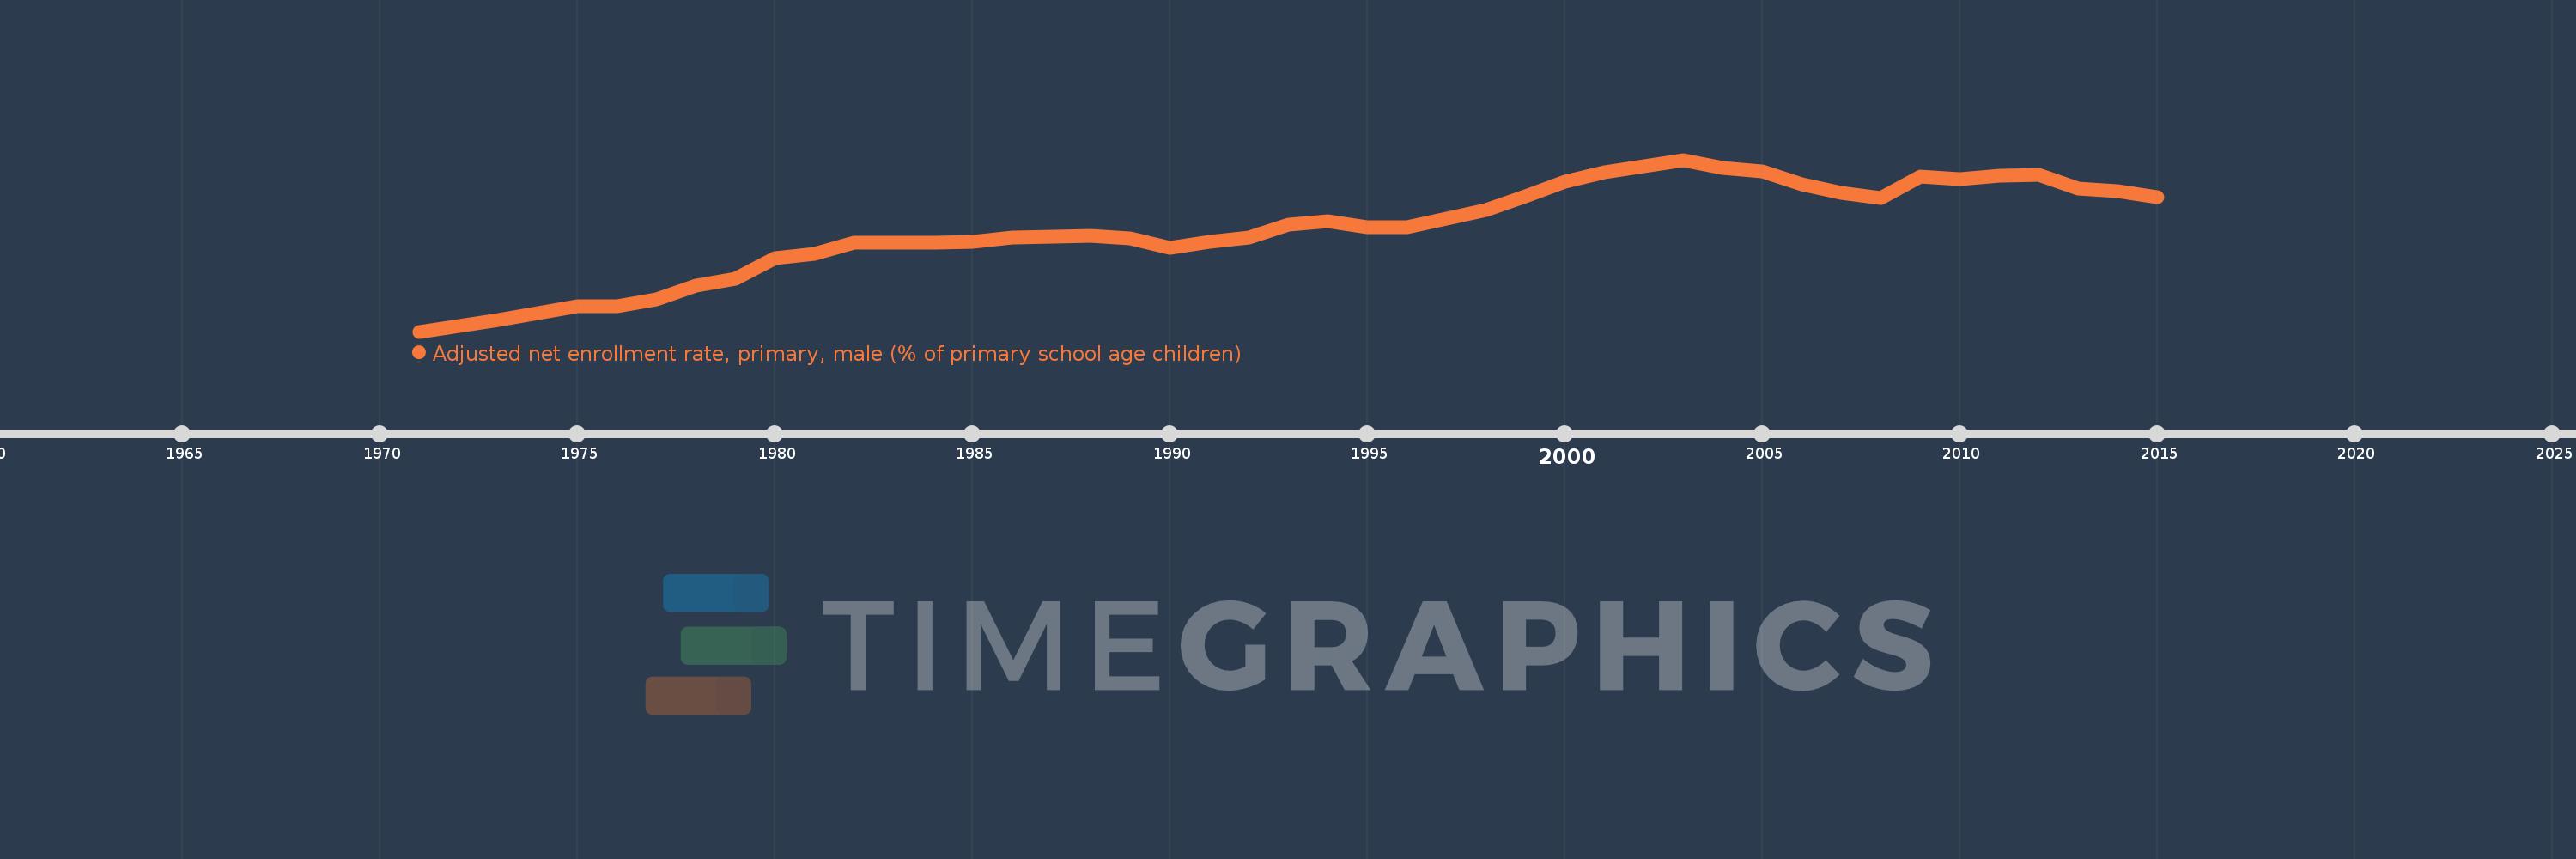
Adjusted net enrollment rate, primary, male (% of primary school age children)
2015,2014,2013,2012,2011,2010,2009,2008,2007,2006,2005,2004,2003,2002,2001,2000,1999,1998,1997,1996,1995,1994,1993,1992,1991,1990,1989,1988,1987,1986,1985,1984,1983,1982,1981,1980,1979,1978,1977,1976,1975,1974,1973,1972,1971
This statistics in other country:
AfghanistanAlbaniaAlgeriaAngolaAntigua and BarbudaArab WorldArgentinaArmeniaArubaAustraliaAustriaAzerbaijanBahamas, TheBahrainBangladeshBarbadosBelarusBelgiumBelizeBeninBermudaBhutanBoliviaBosnia and HerzegovinaBotswanaBrazilBrunei DarussalamBulgariaBurkina FasoBurundiCabo VerdeCambodiaCameroonCanadaCaribbean small statesCentral African RepublicCentral Europe and the BalticsChadChileChinaColombiaComorosCongo, Dem. Rep.Congo, Rep.Costa RicaCote d'IvoireCroatiaCubaCyprusDenmarkDjiboutiDominicaDominican RepublicEarly-demographic dividendEast Asia & PacificEast Asia & Pacific (excluding high income)East Asia & Pacific (IDA & IBRD countries)EcuadorEgypt, Arab Rep.El SalvadorEquatorial GuineaEritreaEstoniaEthiopiaEuro areaEurope & Central AsiaEurope & Central Asia (excluding high income)Europe & Central Asia (IDA & IBRD countries)European UnionFijiFinlandFragile and conflict affected situationsFranceGabonGambia, TheGeorgiaGhanaGreeceGrenadaGuatemalaGuineaGuinea-BissauGuyanaHaitiHeavily indebted poor countries (HIPC)High incomeHondurasHong Kong SAR, ChinaHungaryIBRD onlyIcelandIDA & IBRD totalIDA blendIDA onlyIDA totalIndiaIndonesiaIran, Islamic Rep.IraqIrelandIsraelItalyJamaicaJapanJordanKazakhstanKenyaKiribatiKorea, Dem. People’s Rep.Korea, Rep.KuwaitKyrgyz RepublicLao PDRLate-demographic dividendLatin America & Caribbean Latin America & Caribbean (excluding high income)Latin America & the Caribbean (IDA & IBRD countries)LatviaLeast developed countries: UN classificationLebanonLesothoLiberiaLibyaLiechtensteinLithuaniaLow & middle incomeLow incomeLower middle incomeLuxembourgMacao SAR, ChinaMacedonia, FYRMadagascarMalawiMaldivesMaliMaltaMarshall IslandsMauritaniaMauritiusMexicoMicronesia, Fed. Sts.Middle East & North AfricaMiddle East & North Africa (excluding high income)Middle East & North Africa (IDA & IBRD countries)Middle incomeMoldovaMongoliaMontenegroMoroccoMozambiqueMyanmarNamibiaNauruNepalNetherlandsNew ZealandNicaraguaNigerNigeriaNorth AmericaNorwayOECD membersOmanOther small statesPacific island small statesPakistanPanamaPapua New GuineaParaguayPeruPhilippinesPolandPortugalPost-demographic dividendPre-demographic dividendPuerto RicoQatarRomaniaRussian FederationRwandaSamoaSan MarinoSao Tome and PrincipeSaudi ArabiaSenegalSerbiaSeychellesSierra LeoneSloveniaSmall statesSolomon IslandsSomaliaSouth AfricaSouth AsiaSouth Asia (IDA & IBRD)South SudanSpainSri LankaSt. Kitts and NevisSt. LuciaSt. Vincent and the GrenadinesSub-Saharan Africa Sub-Saharan Africa (excluding high income)Sub-Saharan Africa (IDA & IBRD countries)SudanSurinameSwazilandSwedenSwitzerlandSyrian Arab RepublicTajikistanTanzaniaThailandTimor-LesteTogoTongaTrinidad and TobagoTunisiaTurkeyTuvaluUgandaUkraineUnited Arab EmiratesUnited KingdomUnited StatesUpper middle incomeUruguayUzbekistanVanuatuVenezuela, RBWest Bank and GazaWorldYemen, Rep.ZambiaZimbabwe Timeline:
This timeline shows a graph from 1971 to 2015 of Latin America & the Caribbean (IDA & IBRD countries). No data until 1970. Number of actual observations by date: 45.
Source name:
World Development Indicators
Source organization:
United Nations Educational, Scientific, and Cultural Organization (UNESCO) Institute for Statistics.
Categories, topics:
Education, Gender
Last updated:
apr 23, 2017
Indicators value changes by year
Minimum:
83.258
jan 1, 1971
At the date of observation
Value
Absolute change
Change from previous value
jan 1, 1971
83.258
+83.258
0.0%
jan 1, 1972
83.68
+0.422
0.51%
jan 1, 1973
84.146
+0.466
0.56%
jan 1, 1974
84.724
+0.578
0.69%
jan 1, 1975
85.226
+0.502
0.59%
jan 1, 1976
85.219
-0.007
-0.01%
jan 1, 1977
85.805
+0.586
0.69%
jan 1, 1978
86.845
+1.04
1.21%
jan 1, 1979
87.41
+0.565
0.65%
jan 1, 1980
89.023
+1.613
1.85%
jan 1, 1981
89.319
+0.297
0.33%
jan 1, 1982
90.233
+0.914
1.02%
jan 1, 1983
90.257
+0.024
0.03%
jan 1, 1984
90.225
-0.032
-0.04%
jan 1, 1985
90.286
+0.061
0.07%
jan 1, 1986
90.608
+0.323
0.36%
jan 1, 1987
90.702
+0.094
0.1%
jan 1, 1988
90.771
+0.069
0.08%
jan 1, 1989
90.529
-0.242
-0.27%
jan 1, 1990
89.788
-0.742
-0.82%
jan 1, 1991
90.282
+0.495
0.55%
jan 1, 1992
90.616
+0.334
0.37%
jan 1, 1993
91.629
+1.013
1.12%
jan 1, 1994
91.904
+0.274
0.3%
jan 1, 1995
91.413
-0.491
-0.53%
jan 1, 1996
91.412
-0.001
0.0%
jan 1, 1997
92.104
+0.692
0.76%
jan 1, 1998
92.775
+0.671
0.73%
jan 1, 1999
93.833
+1.058
1.14%
jan 1, 2000
94.987
+1.154
1.23%
jan 1, 2001
95.728
+0.741
0.78%
jan 1, 2002
96.231
+0.503
0.53%
jan 1, 2003
96.72
+0.489
0.51%
jan 1, 2004
96.063
-0.657
-0.68%
jan 1, 2005
95.823
-0.241
-0.25%
jan 1, 2006
94.809
-1.014
-1.06%
jan 1, 2007
94.161
-0.648
-0.68%
jan 1, 2008
93.714
-0.447
-0.47%
jan 1, 2009
95.412
+1.697
1.81%
jan 1, 2010
95.193
-0.219
-0.23%
jan 1, 2011
95.444
+0.251
0.26%
jan 1, 2012
95.55
+0.106
0.11%
jan 1, 2013
94.442
-1.109
-1.16%
jan 1, 2014
94.23
-0.212
-0.22%
jan 1, 2015
93.825
-0.405
-0.43%
Ranking of countries by current statistics by years


Comments: