29
/
en
AIzaSyAYiBZKx7MnpbEhh9jyipgxe19OcubqV5w
April 1, 2024
41825
Latin America & Caribbean
LCN
false
2
1
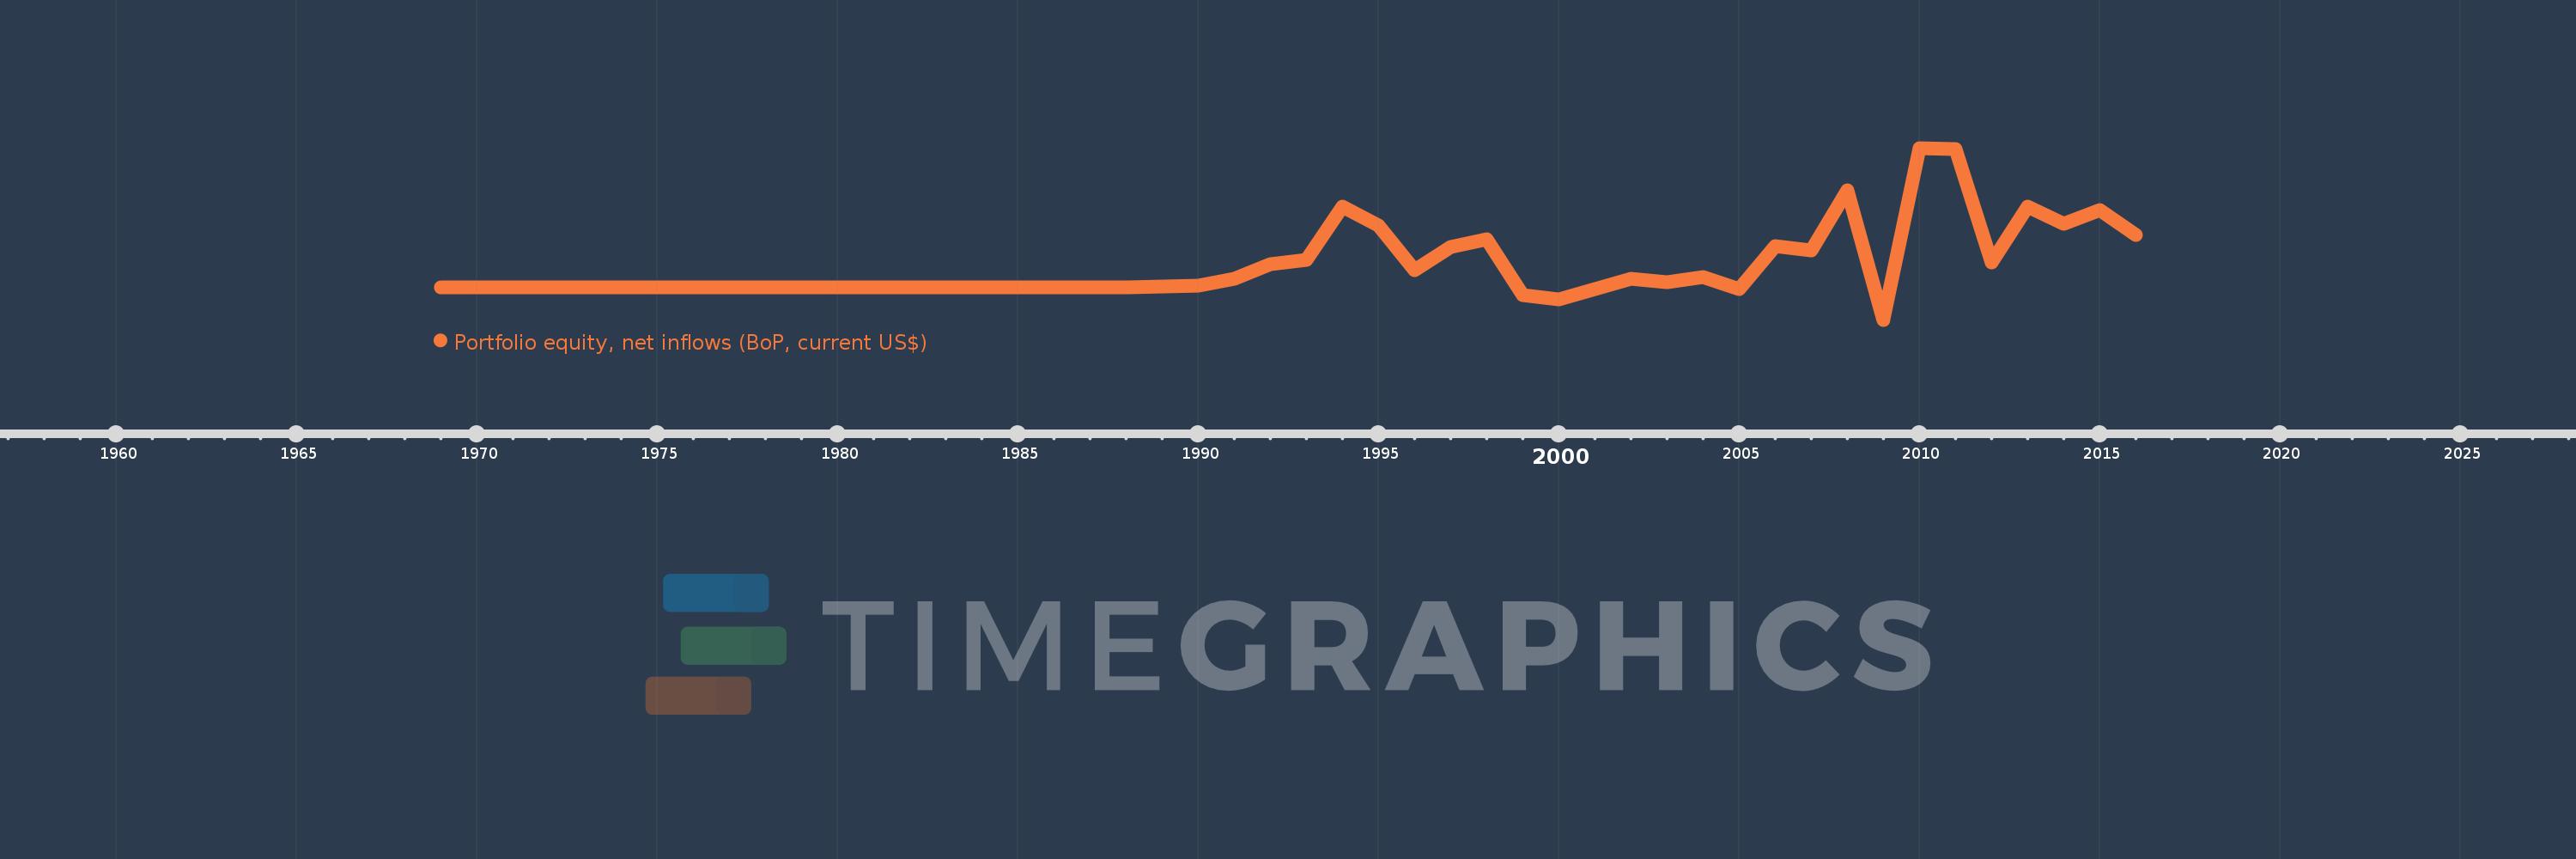
Portfolio equity, net inflows (BoP, current US$)
2016,2015,2014,2013,2012,2011,2010,2009,2008,2007,2006,2005,2004,2003,2002,2001,2000,1999,1998,1997,1996,1995,1994,1993,1992,1991,1990,1989,1988,1987,1986,1985,1984,1983,1982,1981,1980,1979,1978,1977,1976,1975,1974,1973,1972,1971,1970,1969
This statistics in other country:
AfghanistanAlbaniaAlgeriaAngolaAntigua and BarbudaArab WorldArgentinaArmeniaArubaAustraliaAustriaAzerbaijanBahamas, TheBahrainBangladeshBarbadosBelarusBelgiumBelizeBeninBermudaBhutanBoliviaBosnia and HerzegovinaBotswanaBrazilBulgariaBurkina FasoBurundiCabo VerdeCambodiaCameroonCanadaCaribbean small statesCentral African RepublicCentral Europe and the BalticsChadChileChinaColombiaComorosCongo, Dem. Rep.Congo, Rep.Costa RicaCote d'IvoireCroatiaCuracaoCyprusCzech RepublicDenmarkDjiboutiDominicaDominican RepublicEarly-demographic dividendEast Asia & PacificEast Asia & Pacific (excluding high income)East Asia & Pacific (IDA & IBRD countries)EcuadorEgypt, Arab Rep.El SalvadorEquatorial GuineaEstoniaEthiopiaEuro areaEurope & Central AsiaEurope & Central Asia (excluding high income)Europe & Central Asia (IDA & IBRD countries)European UnionFijiFinlandFragile and conflict affected situationsFranceFrench PolynesiaGabonGambia, TheGeorgiaGermanyGhanaGreeceGrenadaGuatemalaGuineaGuinea-BissauGuyanaHaitiHeavily indebted poor countries (HIPC)High incomeHondurasHong Kong SAR, ChinaHungaryIBRD onlyIcelandIDA & IBRD totalIDA blendIDA onlyIDA totalIndiaIndonesiaIran, Islamic Rep.IraqIrelandIsraelItalyJamaicaJapanJordanKazakhstanKenyaKiribatiKorea, Rep.KosovoKuwaitKyrgyz RepublicLao PDRLate-demographic dividendLatin America & Caribbean Latin America & Caribbean (excluding high income)Latin America & the Caribbean (IDA & IBRD countries)LatviaLeast developed countries: UN classificationLebanonLesothoLiberiaLibyaLithuaniaLow & middle incomeLow incomeLower middle incomeLuxembourgMacao SAR, ChinaMacedonia, FYRMadagascarMalawiMalaysiaMaldivesMaliMaltaMarshall IslandsMauritaniaMauritiusMexicoMiddle East & North AfricaMiddle East & North Africa (excluding high income)Middle East & North Africa (IDA & IBRD countries)Middle incomeMoldovaMongoliaMontenegroMoroccoMozambiqueMyanmarNamibiaNepalNetherlandsNew CaledoniaNew ZealandNicaraguaNigerNigeriaNorth AmericaNorwayOECD membersOmanOther small statesPacific island small statesPakistanPanamaPapua New GuineaParaguayPeruPhilippinesPolandPortugalPost-demographic dividendPre-demographic dividendQatarRomaniaRussian FederationRwandaSamoaSao Tome and PrincipeSaudi ArabiaSenegalSerbiaSeychellesSierra LeoneSingaporeSlovak RepublicSloveniaSmall statesSolomon IslandsSomaliaSouth AfricaSouth AsiaSouth Asia (IDA & IBRD)SpainSri LankaSt. Kitts and NevisSt. LuciaSt. Vincent and the GrenadinesSub-Saharan Africa Sub-Saharan Africa (excluding high income)Sub-Saharan Africa (IDA & IBRD countries)SudanSurinameSwazilandSwedenSwitzerlandSyrian Arab RepublicTajikistanTanzaniaThailandTimor-LesteTogoTongaTrinidad and TobagoTunisiaTurkeyUgandaUkraineUnited KingdomUnited StatesUpper middle incomeUruguayVanuatuVenezuela, RBVietnamWest Bank and GazaWorldYemen, Rep.ZambiaZimbabwe Timeline:
This timeline shows a graph from 1969 to 2016 of Latin America & Caribbean . No data until 1968. Number of actual observations by date: 48.
Source name:
World Development Indicators
Source organization:
International Monetary Fund, Balance of Payments database, and World Bank, International Debt Statistics.
Categories, topics:
Economy & Growth, Financial Sector, External Debt
Last updated:
apr 23, 2017
Indicators value changes by year
Minimum:
-9.632 bln
jan 1, 2009
Maximum:
41.559 bln
jan 1, 2010
At the date of observation
Value
Absolute change
Change from previous value
jan 1, 1977
3.28 mln
+3.28 mln
%
jan 1, 1978
-3.3 mln
-6.58 mln
-200.61%
jan 1, 1979
4.82 mln
+8.12 mln
-246.06%
jan 1, 1980
-7.1 mln
-11.92 mln
-247.3%
jan 1, 1981
-6.5 mln
+600.0K
-8.45%
jan 1, 1982
20.75 mln
+27.25 mln
-419.23%
jan 1, 1983
5.0 mln
-15.75 mln
-75.9%
jan 1, 1984
-50.0K
-5.05 mln
-101.0%
jan 1, 1985
-3.25 mln
-3.2 mln
6.4K%
jan 1, 1986
-11.3 mln
-8.05 mln
247.69%
jan 1, 1987
5.35 mln
+16.65 mln
-147.35%
jan 1, 1988
60.2 mln
+54.85 mln
1.03K%
jan 1, 1989
190.198 mln
+129.998 mln
215.94%
jan 1, 1990
527.3 mln
+337.102 mln
177.24%
jan 1, 1991
2.464 bln
+1.937 bln
367.27%
jan 1, 1992
6.934 bln
+4.47 bln
181.43%
jan 1, 1993
8.203 bln
+1.268 bln
18.29%
jan 1, 1994
24.045 bln
+15.842 bln
193.14%
jan 1, 1995
18.377 bln
-5.668 bln
-23.57%
jan 1, 1996
5.232 bln
-13.145 bln
-71.53%
jan 1, 1997
12.063 bln
+6.83 bln
130.54%
jan 1, 1998
14.254 bln
+2.191 bln
18.16%
jan 1, 1999
-2.17 bln
-16.423 bln
-115.22%
jan 1, 2000
-3.624 bln
-1.455 bln
67.04%
jan 1, 2001
-560.725 mln
+3.063 bln
-84.53%
jan 1, 2002
2.516 bln
+3.076 bln
-548.65%
jan 1, 2003
1.433 bln
-1.082 bln
-43.03%
jan 1, 2004
3.187 bln
+1.754 bln
122.36%
jan 1, 2005
-585.268 mln
-3.772 bln
-118.36%
jan 1, 2006
12.211 bln
+12.796 bln
-2.19K%
jan 1, 2007
11.056 bln
-1.155 bln
-9.46%
jan 1, 2008
28.881 bln
+17.825 bln
161.23%
jan 1, 2009
-9.632 bln
-38.513 bln
-133.35%
jan 1, 2010
41.559 bln
+51.19 bln
-531.47%
jan 1, 2011
41.157 bln
-401.827 mln
-0.97%
jan 1, 2012
7.503 bln
-33.654 bln
-81.77%
jan 1, 2013
24.069 bln
+16.567 bln
220.81%
jan 1, 2014
18.86 bln
-5.21 bln
-21.64%
jan 1, 2015
23.017 bln
+4.157 bln
22.04%
jan 1, 2016
15.681 bln
-7.336 bln
-31.87%
Ranking of countries by current statistics by years


Comments: