29
/
en
AIzaSyAYiBZKx7MnpbEhh9jyipgxe19OcubqV5w
April 1, 2024
39993
IDA total
IDA
false
2
1
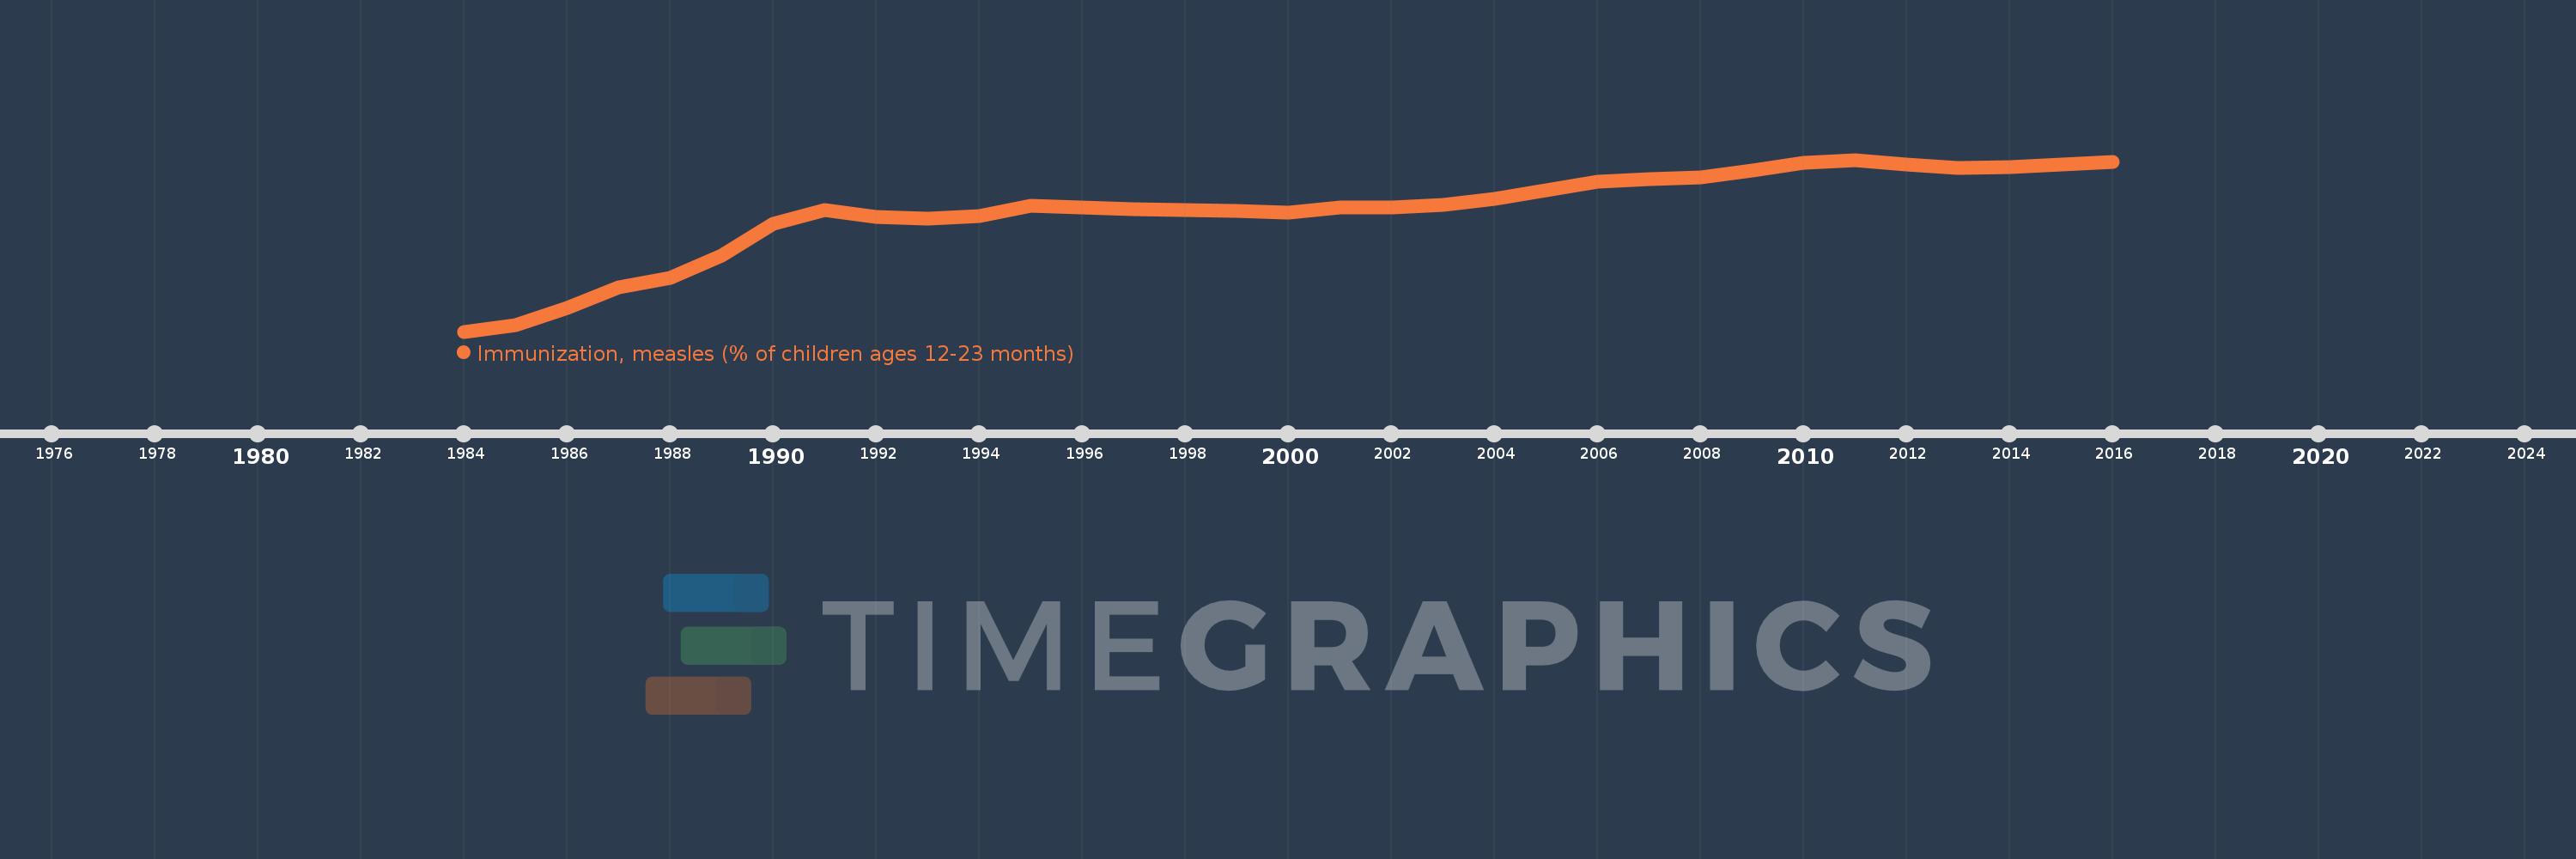
Immunization, measles (% of children ages 12-23 months)
2016,2015,2014,2013,2012,2011,2010,2009,2008,2007,2006,2005,2004,2003,2002,2001,2000,1999,1998,1997,1996,1995,1994,1993,1992,1991,1990,1989,1988,1987,1986,1985,1984
This statistics in other country:
AfghanistanAlbaniaAlgeriaAndorraAngolaAntigua and BarbudaArab WorldArgentinaArmeniaAustraliaAustriaAzerbaijanBahamas, TheBahrainBangladeshBarbadosBelarusBelgiumBelizeBeninBhutanBoliviaBosnia and HerzegovinaBotswanaBrazilBrunei DarussalamBulgariaBurkina FasoBurundiCabo VerdeCambodiaCameroonCanadaCaribbean small statesCentral African RepublicCentral Europe and the BalticsChadChileChinaColombiaComorosCongo, Dem. Rep.Congo, Rep.Costa RicaCote d'IvoireCroatiaCubaCyprusCzech RepublicDenmarkDjiboutiDominicaDominican RepublicEarly-demographic dividendEast Asia & PacificEast Asia & Pacific (excluding high income)East Asia & Pacific (IDA & IBRD countries)EcuadorEgypt, Arab Rep.El SalvadorEquatorial GuineaEritreaEstoniaEthiopiaEuro areaEurope & Central AsiaEurope & Central Asia (excluding high income)Europe & Central Asia (IDA & IBRD countries)European UnionFijiFinlandFragile and conflict affected situationsFranceGabonGambia, TheGeorgiaGermanyGhanaGreeceGrenadaGuatemalaGuineaGuinea-BissauGuyanaHaitiHeavily indebted poor countries (HIPC)High incomeHondurasHungaryIBRD onlyIcelandIDA & IBRD totalIDA blendIDA onlyIDA totalIndiaIndonesiaIran, Islamic Rep.IraqIrelandIsraelItalyJamaicaJapanJordanKazakhstanKenyaKiribatiKorea, Dem. People’s Rep.Korea, Rep.KuwaitKyrgyz RepublicLao PDRLate-demographic dividendLatin America & Caribbean Latin America & Caribbean (excluding high income)Latin America & the Caribbean (IDA & IBRD countries)LatviaLeast developed countries: UN classificationLebanonLesothoLiberiaLibyaLithuaniaLow & middle incomeLow incomeLower middle incomeLuxembourgMacedonia, FYRMadagascarMalawiMalaysiaMaldivesMaliMaltaMarshall IslandsMauritaniaMauritiusMexicoMicronesia, Fed. Sts.Middle East & North AfricaMiddle East & North Africa (excluding high income)Middle East & North Africa (IDA & IBRD countries)Middle incomeMoldovaMonacoMongoliaMontenegroMoroccoMozambiqueMyanmarNamibiaNauruNepalNetherlandsNew ZealandNicaraguaNigerNigeriaNorth AmericaNorwayOECD membersOmanOther small statesPacific island small statesPakistanPalauPanamaPapua New GuineaParaguayPeruPhilippinesPolandPortugalPost-demographic dividendPre-demographic dividendQatarRomaniaRussian FederationRwandaSamoaSan MarinoSao Tome and PrincipeSaudi ArabiaSenegalSerbiaSeychellesSierra LeoneSingaporeSlovak RepublicSloveniaSmall statesSolomon IslandsSomaliaSouth AfricaSouth AsiaSouth Asia (IDA & IBRD)South SudanSpainSri LankaSt. Kitts and NevisSt. LuciaSt. Vincent and the GrenadinesSub-Saharan Africa Sub-Saharan Africa (excluding high income)Sub-Saharan Africa (IDA & IBRD countries)SudanSurinameSwazilandSwedenSwitzerlandSyrian Arab RepublicTajikistanTanzaniaThailandTimor-LesteTogoTongaTrinidad and TobagoTunisiaTurkeyTurkmenistanTuvaluUgandaUkraineUnited Arab EmiratesUnited KingdomUnited StatesUpper middle incomeUruguayUzbekistanVanuatuVenezuela, RBVietnamWorldYemen, Rep.ZambiaZimbabwe Timeline:
This timeline shows a graph from 1984 to 2016 of IDA total. No data until 1983. Number of actual observations by date: 33.
Source name:
World Development Indicators
Source organization:
WHO and UNICEF (http://www.who.int/immunization/monitoring_surveillance/en/).
Categories, topics:
Health
Last updated:
apr 23, 2017
Indicators value changes by year
Minimum:
18.468
jan 1, 1984
Maximum:
75.766
jan 1, 2011
At the date of observation
Value
Absolute change
Change from previous value
jan 1, 1984
18.468
+18.468
0.0%
jan 1, 1985
20.601
+2.133
11.55%
jan 1, 1986
26.383
+5.782
28.07%
jan 1, 1987
33.092
+6.71
25.43%
jan 1, 1988
36.347
+3.255
9.84%
jan 1, 1989
43.899
+7.551
20.78%
jan 1, 1990
54.535
+10.636
24.23%
jan 1, 1991
59.089
+4.554
8.35%
jan 1, 1992
56.769
-2.32
-3.93%
jan 1, 1993
56.058
-0.711
-1.25%
jan 1, 1994
57.134
+1.076
1.92%
jan 1, 1995
60.328
+3.194
5.59%
jan 1, 1996
59.993
-0.335
-0.56%
jan 1, 1997
59.241
-0.752
-1.25%
jan 1, 1998
59.026
-0.215
-0.36%
jan 1, 1999
58.715
-0.311
-0.53%
jan 1, 2000
58.053
-0.662
-1.13%
jan 1, 2001
59.992
+1.939
3.34%
jan 1, 2002
59.868
-0.124
-0.21%
jan 1, 2003
60.679
+0.812
1.36%
jan 1, 2004
62.775
+2.096
3.45%
jan 1, 2005
65.68
+2.905
4.63%
jan 1, 2006
68.406
+2.726
4.15%
jan 1, 2007
69.361
+0.955
1.4%
jan 1, 2008
69.933
+0.572
0.82%
jan 1, 2009
72.104
+2.172
3.11%
jan 1, 2010
74.659
+2.555
3.54%
jan 1, 2011
75.766
+1.107
1.48%
jan 1, 2012
74.256
-1.51
-1.99%
jan 1, 2013
73.112
-1.144
-1.54%
jan 1, 2014
73.218
+0.106
0.15%
jan 1, 2015
74.116
+0.898
1.23%
jan 1, 2016
75.056
+0.94
1.27%
Ranking of countries by current statistics by years


Comments: