29
/
en
AIzaSyAYiBZKx7MnpbEhh9jyipgxe19OcubqV5w
April 1, 2024
39810
IDA total
IDA
false
2
1
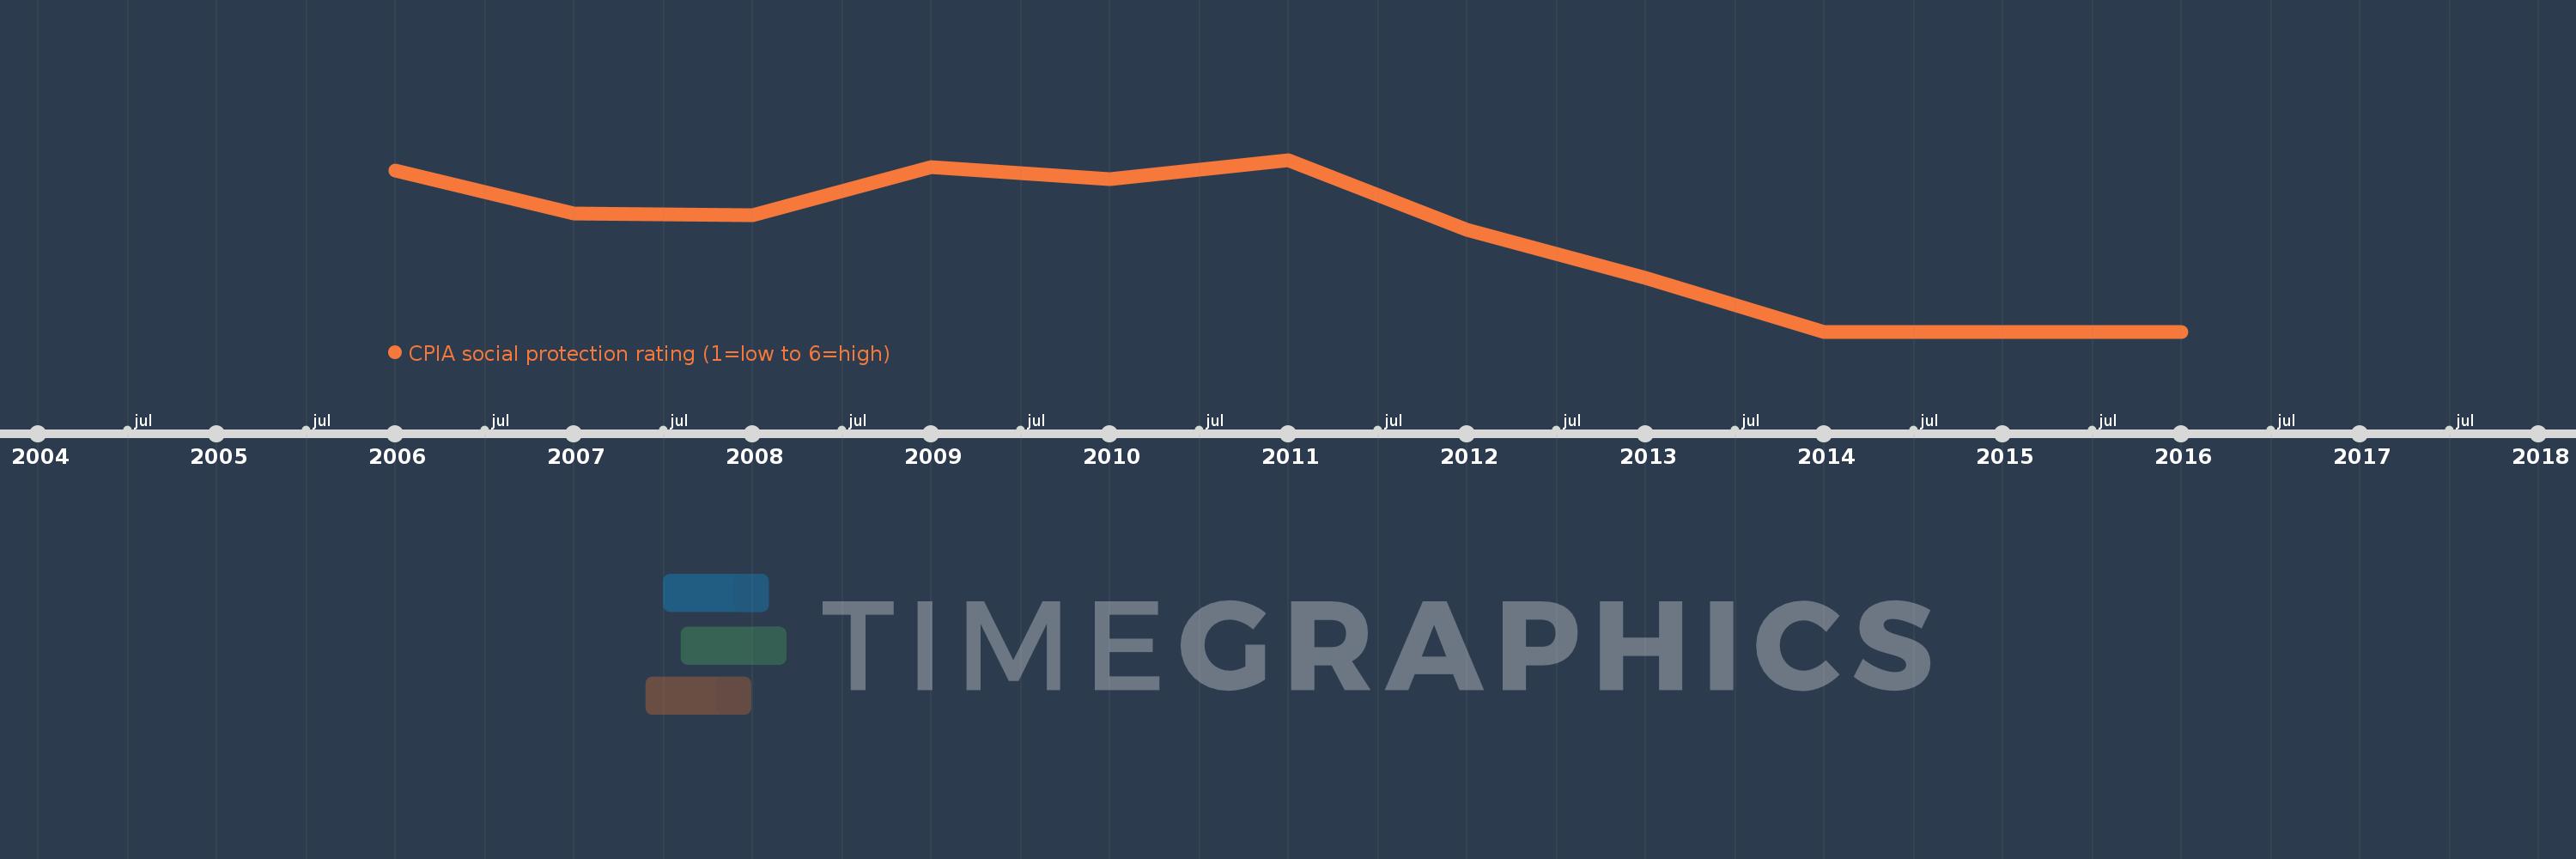
CPIA social protection rating (1=low to 6=high)
2016,2015,2014,2013,2012,2011,2010,2009,2008,2007,2006
This statistics in other country:
Timeline:
This timeline shows a graph from 2006 to 2016 of IDA total. No data until 2005. Number of actual observations by date: 11.
Source name:
World Development Indicators
Source organization:
World Bank Group, CPIA database (http://www.worldbank.org/ida).
Categories, topics:
Public Sector
Last updated:
apr 23, 2017
Indicators value changes by year
At the date of observation
Value
Absolute change
Change from previous value
jan 1, 2006
3.091
+3.091
0.0%
jan 1, 2007
3.06
-0.031
-1.01%
jan 1, 2008
3.059
-0.001
-0.03%
jan 1, 2009
3.094
+0.035
1.16%
jan 1, 2010
3.085
-0.01
-0.31%
jan 1, 2011
3.099
+0.014
0.46%
jan 1, 2012
3.048
-0.051
-1.63%
jan 1, 2013
3.013
-0.035
-1.14%
jan 1, 2014
2.974
-0.04
-1.32%
jan 1, 2015
2.974
0.0
0.0%
jan 1, 2016
2.974
0.0
0.0%
Ranking of countries by current statistics by years


Comments: