29
/
en
AIzaSyAYiBZKx7MnpbEhh9jyipgxe19OcubqV5w
April 1, 2024
39800
IDA total
IDA
false
2
1
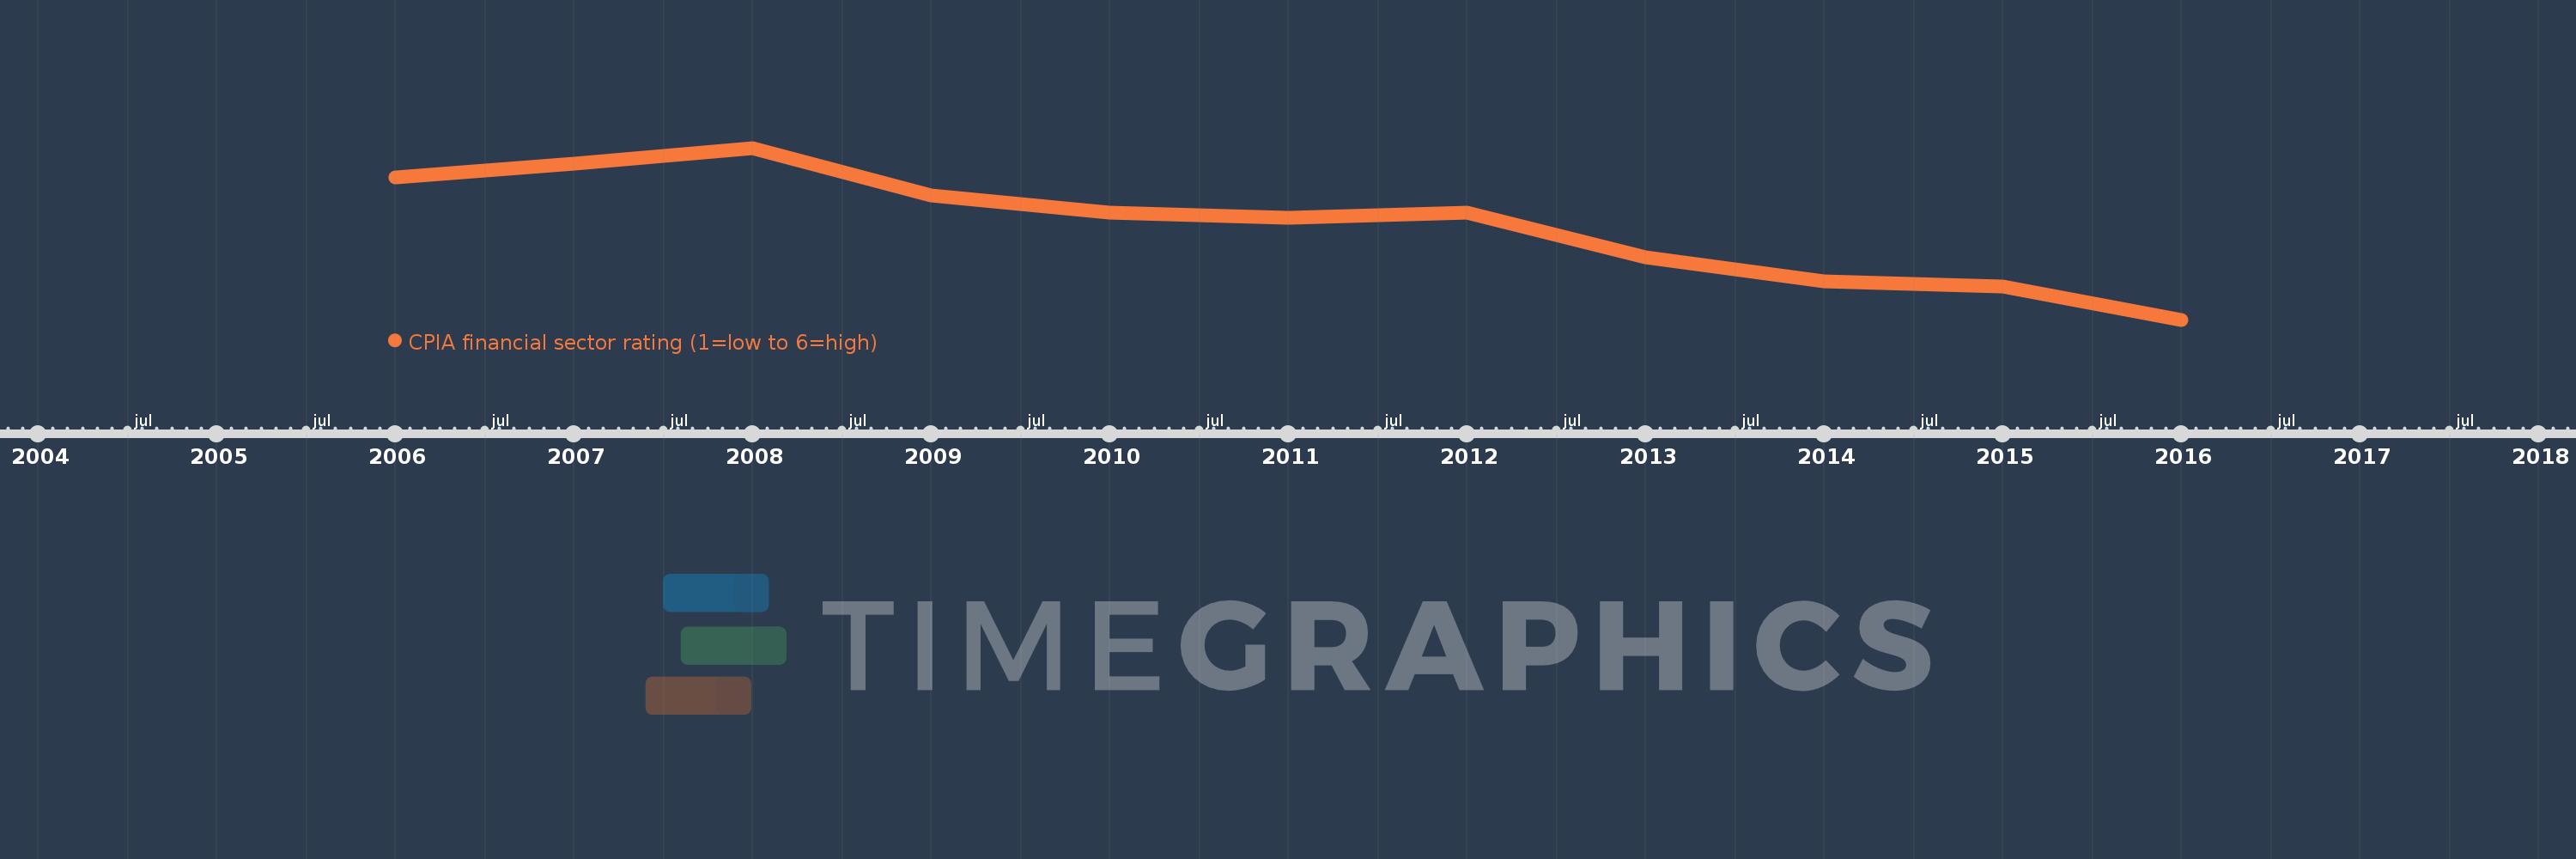
CPIA financial sector rating (1=low to 6=high)
2016,2015,2014,2013,2012,2011,2010,2009,2008,2007,2006
This statistics in other country:
Timeline:
This timeline shows a graph from 2006 to 2016 of IDA total. No data until 2005. Number of actual observations by date: 11.
Source name:
World Development Indicators
Source organization:
World Bank Group, CPIA database (http://www.worldbank.org/ida).
Categories, topics:
Public Sector
Last updated:
apr 23, 2017
Indicators value changes by year
At the date of observation
Value
Absolute change
Change from previous value
jan 1, 2006
3.09
+3.09
0.0%
jan 1, 2007
3.109
+0.019
0.62%
jan 1, 2008
3.13
+0.022
0.7%
jan 1, 2009
3.065
-0.065
-2.08%
jan 1, 2010
3.042
-0.023
-0.75%
jan 1, 2011
3.035
-0.007
-0.23%
jan 1, 2012
3.041
+0.006
0.19%
jan 1, 2013
2.98
-0.061
-2.01%
jan 1, 2014
2.947
-0.033
-1.1%
jan 1, 2015
2.941
-0.007
-0.22%
jan 1, 2016
2.895
-0.046
-1.57%
Ranking of countries by current statistics by years


Comments: