29
/
en
AIzaSyAYiBZKx7MnpbEhh9jyipgxe19OcubqV5w
April 1, 2024
39007
IDA only
IDX
false
2
1
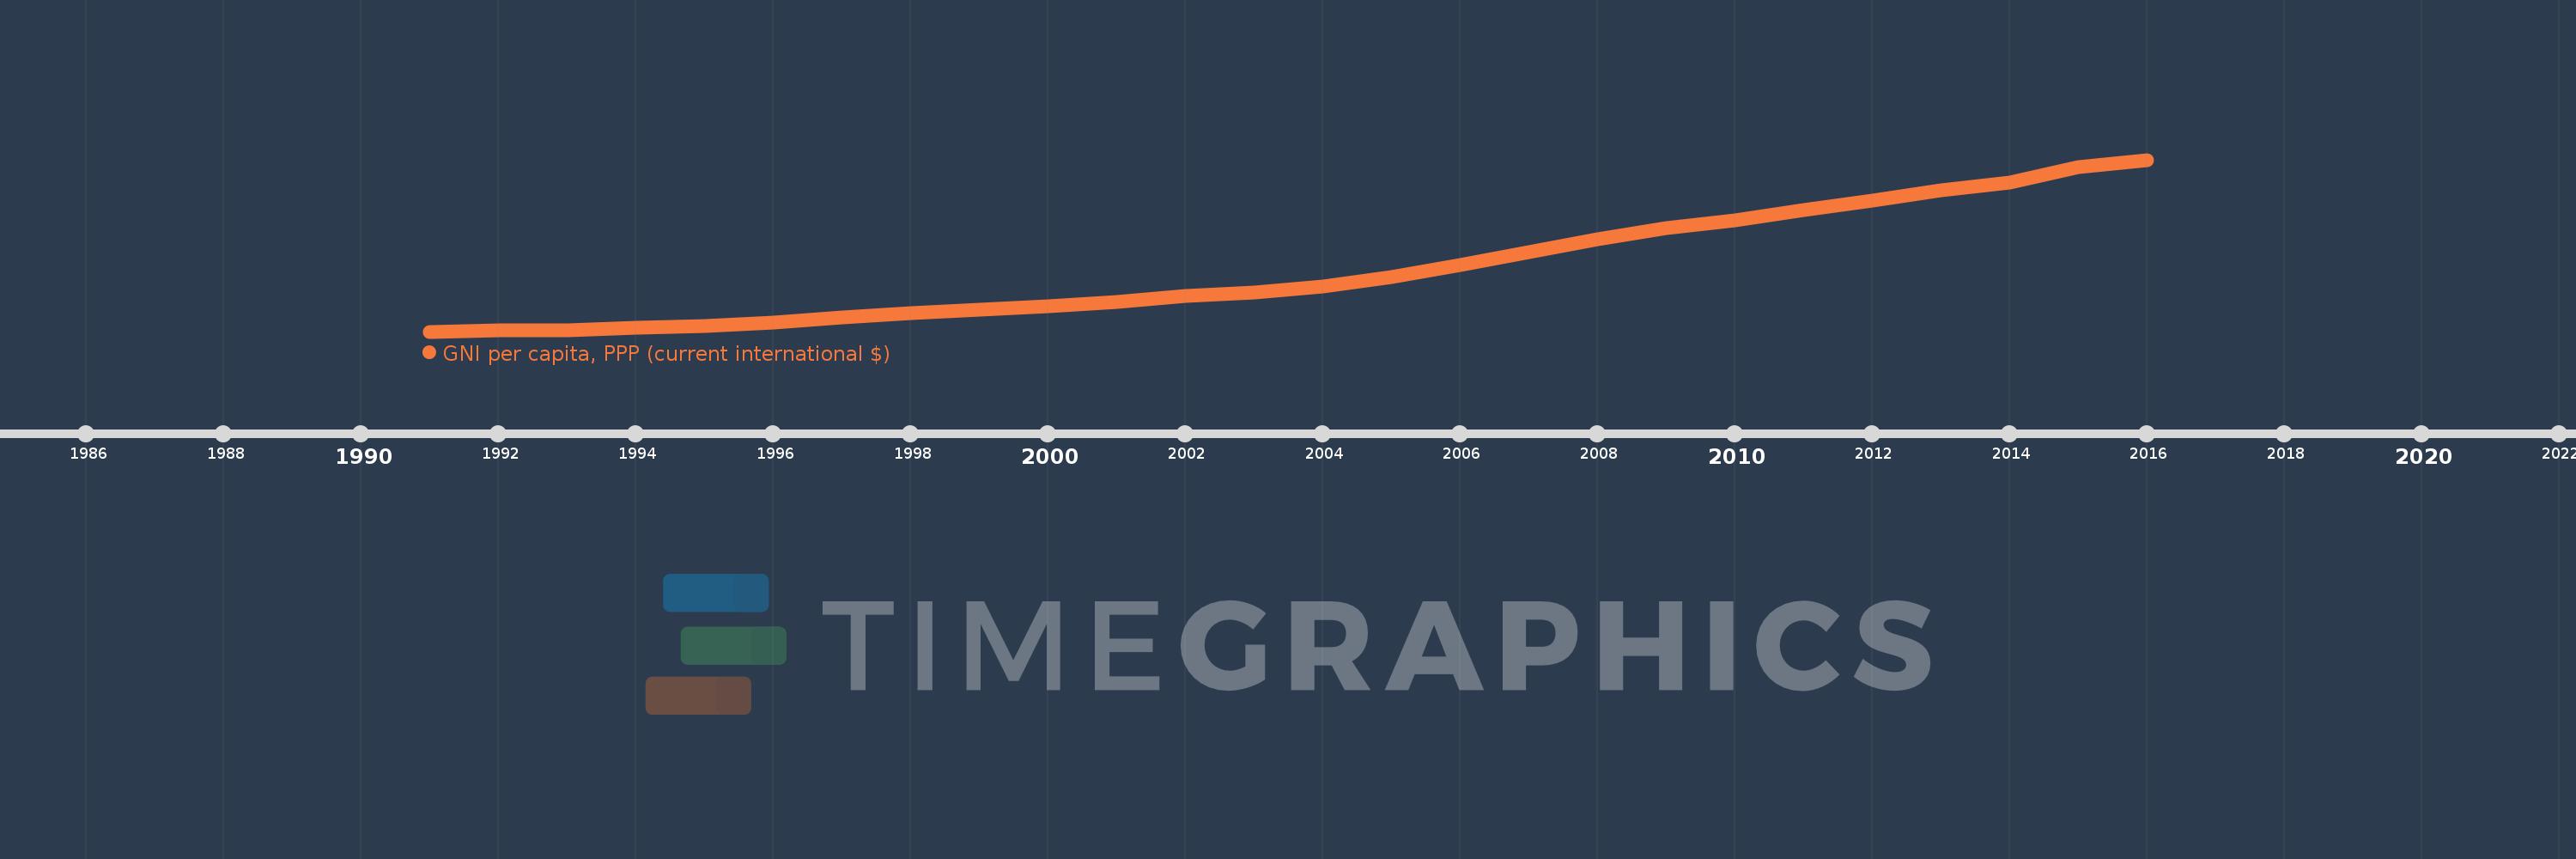
GNI per capita, PPP (current international $)
2016,2015,2014,2013,2012,2011,2010,2009,2008,2007,2006,2005,2004,2003,2002,2001,2000,1999,1998,1997,1996,1995,1994,1993,1992,1991
This statistics in other country:
AfghanistanAlbaniaAlgeriaAngolaAntigua and BarbudaArab WorldArgentinaArmeniaAustraliaAustriaAzerbaijanBahamas, TheBahrainBangladeshBarbadosBelarusBelgiumBelizeBeninBermudaBhutanBoliviaBosnia and HerzegovinaBotswanaBrazilBrunei DarussalamBulgariaBurkina FasoBurundiCabo VerdeCambodiaCameroonCanadaCaribbean small statesCentral African RepublicCentral Europe and the BalticsChadChileChinaColombiaComorosCongo, Dem. Rep.Congo, Rep.Costa RicaCote d'IvoireCroatiaCubaCyprusCzech RepublicDenmarkDjiboutiDominicaDominican RepublicEarly-demographic dividendEast Asia & PacificEast Asia & Pacific (excluding high income)East Asia & Pacific (IDA & IBRD countries)EcuadorEgypt, Arab Rep.El SalvadorEquatorial GuineaEritreaEstoniaEthiopiaEuro areaEurope & Central AsiaEurope & Central Asia (excluding high income)Europe & Central Asia (IDA & IBRD countries)European UnionFijiFinlandFragile and conflict affected situationsFranceGabonGambia, TheGeorgiaGermanyGhanaGreeceGrenadaGuatemalaGuineaGuinea-BissauGuyanaHaitiHeavily indebted poor countries (HIPC)High incomeHondurasHong Kong SAR, ChinaHungaryIBRD onlyIcelandIDA & IBRD totalIDA blendIDA onlyIDA totalIndiaIndonesiaIran, Islamic Rep.IraqIrelandIsraelItalyJamaicaJapanJordanKazakhstanKenyaKiribatiKorea, Rep.KosovoKuwaitKyrgyz RepublicLao PDRLate-demographic dividendLatin America & Caribbean Latin America & Caribbean (excluding high income)Latin America & the Caribbean (IDA & IBRD countries)LatviaLeast developed countries: UN classificationLebanonLesothoLiberiaLibyaLithuaniaLow & middle incomeLow incomeLower middle incomeLuxembourgMacao SAR, ChinaMacedonia, FYRMadagascarMalawiMalaysiaMaldivesMaliMaltaMarshall IslandsMauritaniaMauritiusMexicoMicronesia, Fed. Sts.Middle East & North AfricaMiddle East & North Africa (excluding high income)Middle East & North Africa (IDA & IBRD countries)Middle incomeMoldovaMongoliaMontenegroMoroccoMozambiqueMyanmarNamibiaNauruNepalNetherlandsNew ZealandNicaraguaNigerNigeriaNorth AmericaNorwayOECD membersOmanOther small statesPacific island small statesPakistanPalauPanamaPapua New GuineaParaguayPeruPhilippinesPolandPortugalPost-demographic dividendPre-demographic dividendPuerto RicoQatarRomaniaRussian FederationRwandaSamoaSao Tome and PrincipeSaudi ArabiaSenegalSerbiaSeychellesSierra LeoneSingaporeSlovak RepublicSloveniaSmall statesSolomon IslandsSouth AfricaSouth AsiaSouth Asia (IDA & IBRD)South SudanSpainSri LankaSt. Kitts and NevisSt. LuciaSt. Vincent and the GrenadinesSub-Saharan Africa Sub-Saharan Africa (excluding high income)Sub-Saharan Africa (IDA & IBRD countries)SudanSurinameSwazilandSwedenSwitzerlandTajikistanTanzaniaThailandTimor-LesteTogoTongaTrinidad and TobagoTunisiaTurkeyTurkmenistanTuvaluUgandaUkraineUnited Arab EmiratesUnited KingdomUnited StatesUpper middle incomeUruguayUzbekistanVanuatuVenezuela, RBVietnamWest Bank and GazaWorldYemen, Rep.ZambiaZimbabwe Timeline:
This timeline shows a graph from 1991 to 2016 of IDA only. No data until 1990. Number of actual observations by date: 26.
Source name:
World Development Indicators
Source organization:
World Bank, International Comparison Program database.
Categories, topics:
Economy & Growth
Last updated:
apr 23, 2017
Indicators value changes by year
Minimum:
945.084
jan 1, 1991
Maximum:
2.694K
jan 1, 2016
At the date of observation
Value
Absolute change
Change from previous value
jan 1, 1991
945.084
+945.084
0.0%
jan 1, 1992
957.13
+12.046
1.27%
jan 1, 1993
962.372
+5.242
0.55%
jan 1, 1994
983.698
+21.326
2.22%
jan 1, 1995
999.554
+15.856
1.61%
jan 1, 1996
1.041K
+41.506
4.15%
jan 1, 1997
1.092K
+50.772
4.88%
jan 1, 1998
1.133K
+41.44
3.8%
jan 1, 1999
1.166K
+33.02
2.91%
jan 1, 2000
1.201K
+34.736
2.98%
jan 1, 2001
1.249K
+47.475
3.95%
jan 1, 2002
1.305K
+56.811
4.55%
jan 1, 2003
1.346K
+41.004
3.14%
jan 1, 2004
1.407K
+60.462
4.49%
jan 1, 2005
1.498K
+90.906
6.46%
jan 1, 2006
1.62K
+122.349
8.17%
jan 1, 2007
1.751K
+131.203
8.1%
jan 1, 2008
1.889K
+137.534
7.85%
jan 1, 2009
2.0K
+111.106
5.88%
jan 1, 2010
2.078K
+77.996
3.9%
jan 1, 2011
2.181K
+103.213
4.97%
jan 1, 2012
2.277K
+95.525
4.38%
jan 1, 2013
2.387K
+110.058
4.83%
jan 1, 2014
2.462K
+75.434
3.16%
jan 1, 2015
2.623K
+160.574
6.52%
jan 1, 2016
2.694K
+71.806
2.74%
Ranking of countries by current statistics by years


Comments: