29
/
en
AIzaSyAYiBZKx7MnpbEhh9jyipgxe19OcubqV5w
April 1, 2024
38694
IDA only
IDX
false
2
1
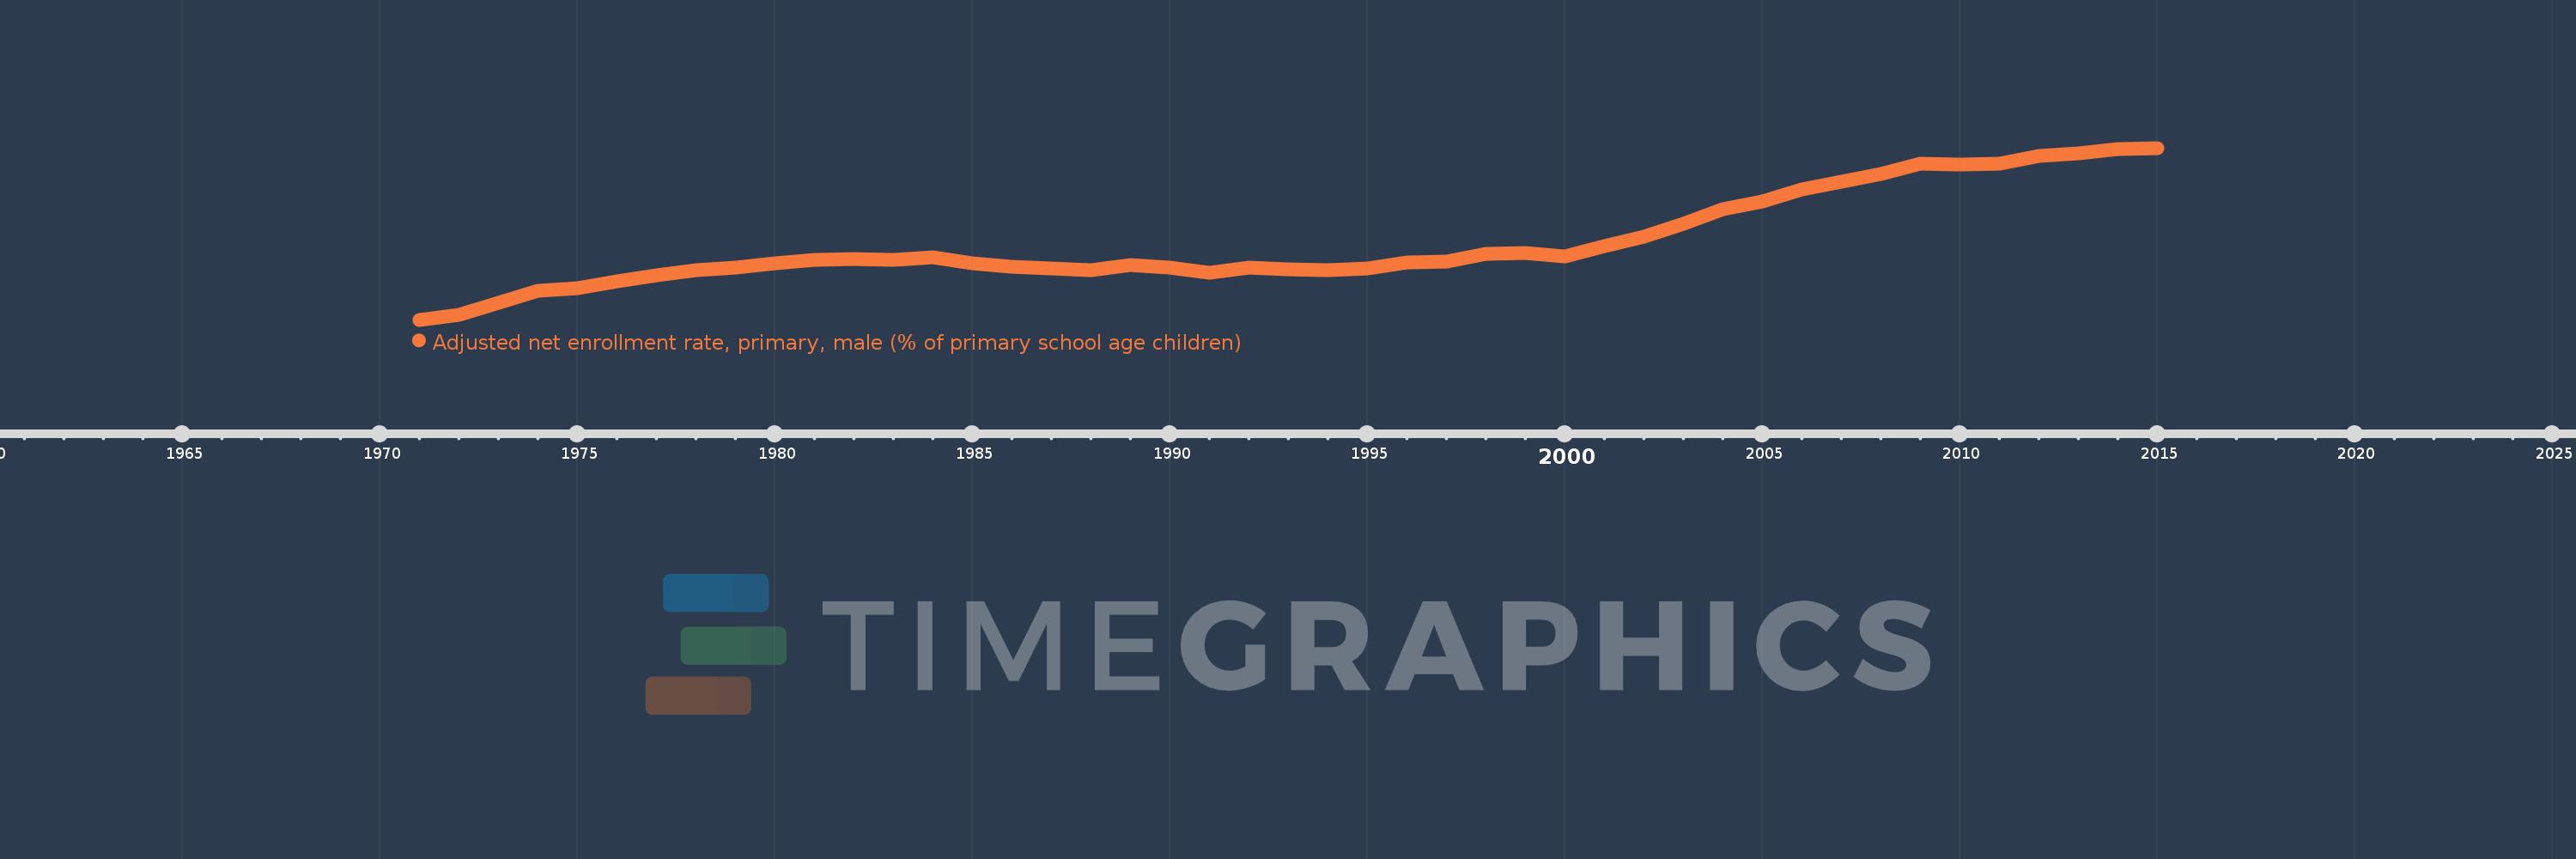
Adjusted net enrollment rate, primary, male (% of primary school age children)
2015,2014,2013,2012,2011,2010,2009,2008,2007,2006,2005,2004,2003,2002,2001,2000,1999,1998,1997,1996,1995,1994,1993,1992,1991,1990,1989,1988,1987,1986,1985,1984,1983,1982,1981,1980,1979,1978,1977,1976,1975,1974,1973,1972,1971
This statistics in other country:
AfghanistanAlbaniaAlgeriaAngolaAntigua and BarbudaArab WorldArgentinaArmeniaArubaAustraliaAustriaAzerbaijanBahamas, TheBahrainBangladeshBarbadosBelarusBelgiumBelizeBeninBermudaBhutanBoliviaBosnia and HerzegovinaBotswanaBrazilBrunei DarussalamBulgariaBurkina FasoBurundiCabo VerdeCambodiaCameroonCanadaCaribbean small statesCentral African RepublicCentral Europe and the BalticsChadChileChinaColombiaComorosCongo, Dem. Rep.Congo, Rep.Costa RicaCote d'IvoireCroatiaCubaCyprusDenmarkDjiboutiDominicaDominican RepublicEarly-demographic dividendEast Asia & PacificEast Asia & Pacific (excluding high income)East Asia & Pacific (IDA & IBRD countries)EcuadorEgypt, Arab Rep.El SalvadorEquatorial GuineaEritreaEstoniaEthiopiaEuro areaEurope & Central AsiaEurope & Central Asia (excluding high income)Europe & Central Asia (IDA & IBRD countries)European UnionFijiFinlandFragile and conflict affected situationsFranceGabonGambia, TheGeorgiaGhanaGreeceGrenadaGuatemalaGuineaGuinea-BissauGuyanaHaitiHeavily indebted poor countries (HIPC)High incomeHondurasHong Kong SAR, ChinaHungaryIBRD onlyIcelandIDA & IBRD totalIDA blendIDA onlyIDA totalIndiaIndonesiaIran, Islamic Rep.IraqIrelandIsraelItalyJamaicaJapanJordanKazakhstanKenyaKiribatiKorea, Dem. People’s Rep.Korea, Rep.KuwaitKyrgyz RepublicLao PDRLate-demographic dividendLatin America & Caribbean Latin America & Caribbean (excluding high income)Latin America & the Caribbean (IDA & IBRD countries)LatviaLeast developed countries: UN classificationLebanonLesothoLiberiaLibyaLiechtensteinLithuaniaLow & middle incomeLow incomeLower middle incomeLuxembourgMacao SAR, ChinaMacedonia, FYRMadagascarMalawiMaldivesMaliMaltaMarshall IslandsMauritaniaMauritiusMexicoMicronesia, Fed. Sts.Middle East & North AfricaMiddle East & North Africa (excluding high income)Middle East & North Africa (IDA & IBRD countries)Middle incomeMoldovaMongoliaMontenegroMoroccoMozambiqueMyanmarNamibiaNauruNepalNetherlandsNew ZealandNicaraguaNigerNigeriaNorth AmericaNorwayOECD membersOmanOther small statesPacific island small statesPakistanPanamaPapua New GuineaParaguayPeruPhilippinesPolandPortugalPost-demographic dividendPre-demographic dividendPuerto RicoQatarRomaniaRussian FederationRwandaSamoaSan MarinoSao Tome and PrincipeSaudi ArabiaSenegalSerbiaSeychellesSierra LeoneSloveniaSmall statesSolomon IslandsSomaliaSouth AfricaSouth AsiaSouth Asia (IDA & IBRD)South SudanSpainSri LankaSt. Kitts and NevisSt. LuciaSt. Vincent and the GrenadinesSub-Saharan Africa Sub-Saharan Africa (excluding high income)Sub-Saharan Africa (IDA & IBRD countries)SudanSurinameSwazilandSwedenSwitzerlandSyrian Arab RepublicTajikistanTanzaniaThailandTimor-LesteTogoTongaTrinidad and TobagoTunisiaTurkeyTuvaluUgandaUkraineUnited Arab EmiratesUnited KingdomUnited StatesUpper middle incomeUruguayUzbekistanVanuatuVenezuela, RBWest Bank and GazaWorldYemen, Rep.ZambiaZimbabwe Timeline:
This timeline shows a graph from 1971 to 2015 of IDA only. No data until 1970. Number of actual observations by date: 45.
Source name:
World Development Indicators
Source organization:
United Nations Educational, Scientific, and Cultural Organization (UNESCO) Institute for Statistics.
Categories, topics:
Education, Gender
Last updated:
apr 23, 2017
Indicators value changes by year
Minimum:
50.529
jan 1, 1971
Maximum:
84.318
jan 1, 2015
At the date of observation
Value
Absolute change
Change from previous value
jan 1, 1971
50.529
+50.529
0.0%
jan 1, 1972
51.519
+0.99
1.96%
jan 1, 1973
53.841
+2.323
4.51%
jan 1, 1974
56.17
+2.328
4.32%
jan 1, 1975
56.727
+0.557
0.99%
jan 1, 1976
58.035
+1.309
2.31%
jan 1, 1977
59.305
+1.27
2.19%
jan 1, 1978
60.306
+1.001
1.69%
jan 1, 1979
60.762
+0.456
0.76%
jan 1, 1980
61.656
+0.894
1.47%
jan 1, 1981
62.315
+0.659
1.07%
jan 1, 1982
62.543
+0.228
0.37%
jan 1, 1983
62.331
-0.211
-0.34%
jan 1, 1984
62.87
+0.539
0.87%
jan 1, 1985
61.6
-1.27
-2.02%
jan 1, 1986
60.951
-0.649
-1.05%
jan 1, 1987
60.642
-0.31
-0.51%
jan 1, 1988
60.237
-0.404
-0.67%
jan 1, 1989
61.251
+1.014
1.68%
jan 1, 1990
60.722
-0.53
-0.86%
jan 1, 1991
59.82
-0.901
-1.48%
jan 1, 1992
60.775
+0.955
1.6%
jan 1, 1993
60.424
-0.351
-0.58%
jan 1, 1994
60.204
-0.22
-0.36%
jan 1, 1995
60.697
+0.493
0.82%
jan 1, 1996
61.848
+1.151
1.9%
jan 1, 1997
61.993
+0.145
0.23%
jan 1, 1998
63.507
+1.514
2.44%
jan 1, 1999
63.6
+0.094
0.15%
jan 1, 2000
63.01
-0.59
-0.93%
jan 1, 2001
65.045
+2.035
3.23%
jan 1, 2002
66.925
+1.88
2.89%
jan 1, 2003
69.328
+2.403
3.59%
jan 1, 2004
72.208
+2.88
4.15%
jan 1, 2005
73.853
+1.644
2.28%
jan 1, 2006
76.168
+2.316
3.14%
jan 1, 2007
77.667
+1.499
1.97%
jan 1, 2008
79.223
+1.556
2.0%
jan 1, 2009
81.218
+1.995
2.52%
jan 1, 2010
81.029
-0.189
-0.23%
jan 1, 2011
81.187
+0.159
0.2%
jan 1, 2012
82.71
+1.523
1.88%
jan 1, 2013
83.329
+0.618
0.75%
jan 1, 2014
84.047
+0.718
0.86%
jan 1, 2015
84.318
+0.271
0.32%
Ranking of countries by current statistics by years


Comments: