29
/
en
AIzaSyAYiBZKx7MnpbEhh9jyipgxe19OcubqV5w
April 1, 2024
37632
IDA & IBRD total
IBT
false
2
1
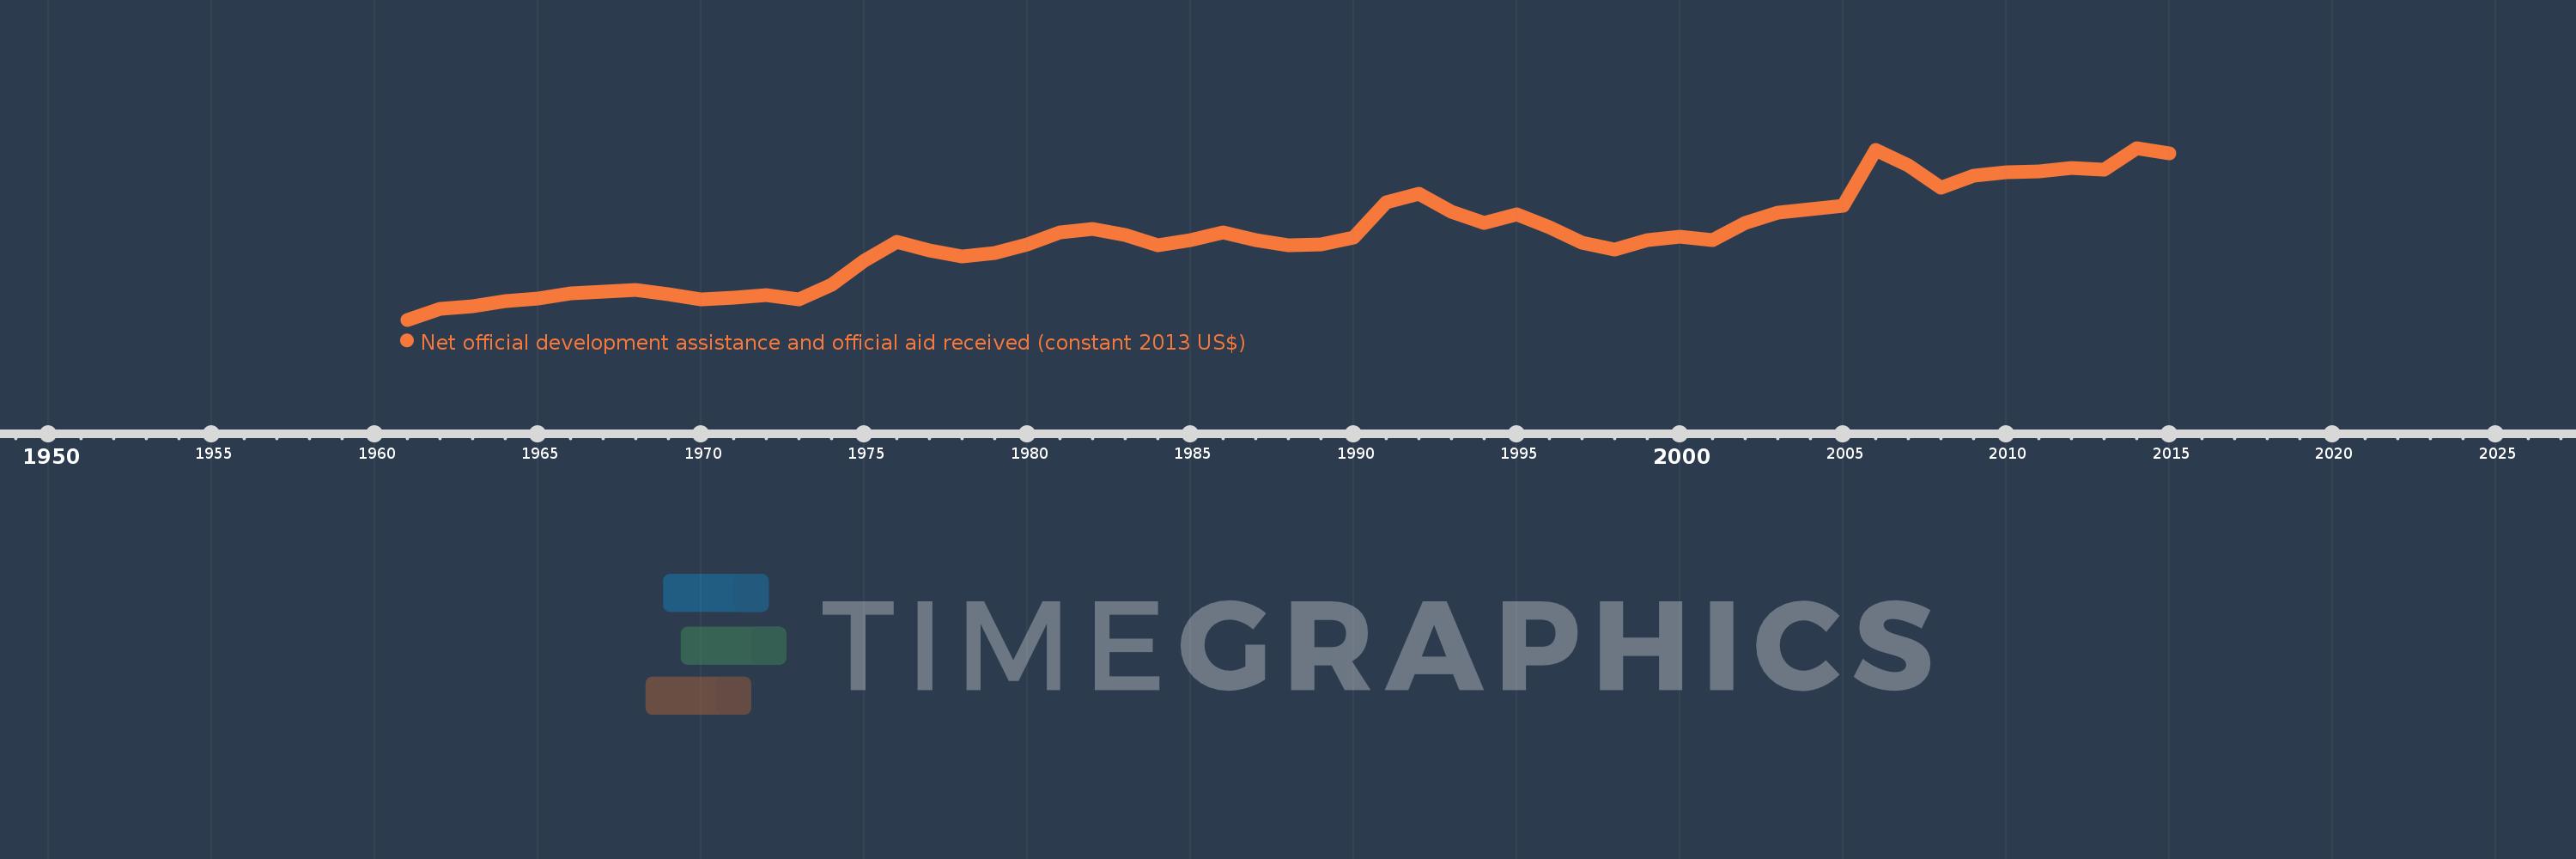
Net official development assistance and official aid received (constant 2013 US$)
2015,2014,2013,2012,2011,2010,2009,2008,2007,2006,2005,2004,2003,2002,2001,2000,1999,1998,1997,1996,1995,1994,1993,1992,1991,1990,1989,1988,1987,1986,1985,1984,1983,1982,1981,1980,1979,1978,1977,1976,1975,1974,1973,1972,1971,1970,1969,1968,1967,1966,1965,1964,1963,1962,1961
This statistics in other country:
AfghanistanAlbaniaAlgeriaAngolaAntigua and BarbudaArab WorldArgentinaArmeniaArubaAzerbaijanBahamas, TheBahrainBangladeshBarbadosBelarusBelizeBeninBermudaBhutanBoliviaBosnia and HerzegovinaBotswanaBrazilBritish Virgin IslandsBrunei DarussalamBulgariaBurkina FasoBurundiCabo VerdeCambodiaCameroonCaribbean small statesCayman IslandsCentral African RepublicCentral Europe and the BalticsChadChileChinaColombiaComorosCongo, Dem. Rep.Congo, Rep.Costa RicaCote d'IvoireCroatiaCubaCyprusCzech RepublicDjiboutiDominicaDominican RepublicEast Asia & PacificEast Asia & Pacific (excluding high income)East Asia & Pacific (IDA & IBRD countries)EcuadorEgypt, Arab Rep.El SalvadorEquatorial GuineaEritreaEstoniaEthiopiaEuro areaEurope & Central AsiaEurope & Central Asia (excluding high income)Europe & Central Asia (IDA & IBRD countries)European UnionFijiFragile and conflict affected situationsFrench PolynesiaGabonGambia, TheGeorgiaGhanaGibraltarGrenadaGuatemalaGuineaGuinea-BissauGuyanaHaitiHeavily indebted poor countries (HIPC)High incomeHondurasHong Kong SAR, ChinaHungaryIBRD onlyIDA & IBRD totalIDA blendIDA onlyIDA totalIndiaIndonesiaIran, Islamic Rep.IraqIsraelJamaicaJordanKazakhstanKenyaKiribatiKorea, Dem. People’s Rep.Korea, Rep.KosovoKuwaitKyrgyz RepublicLao PDRLatin America & Caribbean Latin America & Caribbean (excluding high income)Latin America & the Caribbean (IDA & IBRD countries)LatviaLeast developed countries: UN classificationLebanonLesothoLiberiaLibyaLithuaniaLow & middle incomeLow incomeLower middle incomeMacao SAR, ChinaMacedonia, FYRMadagascarMalawiMalaysiaMaldivesMaliMaltaMarshall IslandsMauritaniaMauritiusMexicoMicronesia, Fed. Sts.Middle East & North AfricaMiddle East & North Africa (excluding high income)Middle East & North Africa (IDA & IBRD countries)Middle incomeMoldovaMongoliaMontenegroMoroccoMozambiqueMyanmarNamibiaNauruNepalNew CaledoniaNicaraguaNigerNigeriaNorth AmericaNorthern Mariana IslandsOECD membersOmanOther small statesPacific island small statesPakistanPalauPanamaPapua New GuineaParaguayPeruPhilippinesPolandQatarRomaniaRussian FederationRwandaSamoaSao Tome and PrincipeSaudi ArabiaSenegalSerbiaSeychellesSierra LeoneSingaporeSlovak RepublicSloveniaSmall statesSolomon IslandsSomaliaSouth AfricaSouth AsiaSouth Asia (IDA & IBRD)South SudanSri LankaSt. Kitts and NevisSt. LuciaSt. Vincent and the GrenadinesSub-Saharan Africa Sub-Saharan Africa (excluding high income)Sub-Saharan Africa (IDA & IBRD countries)SudanSurinameSwazilandSyrian Arab RepublicTajikistanTanzaniaThailandTimor-LesteTogoTongaTrinidad and TobagoTunisiaTurkeyTurkmenistanTurks and Caicos IslandsTuvaluUgandaUkraineUnited Arab EmiratesUpper middle incomeUruguayUzbekistanVanuatuVenezuela, RBVietnamWest Bank and GazaWorldYemen, Rep.ZambiaZimbabwe Timeline:
This timeline shows a graph from 1961 to 2015 of IDA & IBRD total. No data until 1960. Number of actual observations by date: 55.
Source name:
World Development Indicators
Source organization:
Development Assistance Committee of the Organisation for Economic Co-operation and Development, Geographical Distribution of Financial Flows to Developing Countries, Development Co-operation Report, and International Development Statistics database. Data are available online at: www.oecd.org/dac/stats/idsonline.
Categories, topics:
Aid Effectiveness
Last updated:
apr 23, 2017
Indicators value changes by year
Minimum:
24.634 bln
jan 1, 1961
Maximum:
101.645 bln
jan 1, 2014
At the date of observation
Value
Absolute change
Change from previous value
jan 1, 1961
24.634 bln
+24.634 bln
0.0%
jan 1, 1962
29.623 bln
+4.989 bln
20.25%
jan 1, 1963
30.504 bln
+880.21 mln
2.97%
jan 1, 1964
32.968 bln
+2.464 bln
8.08%
jan 1, 1965
34.05 bln
+1.082 bln
3.28%
jan 1, 1966
36.631 bln
+2.581 bln
7.58%
jan 1, 1967
37.086 bln
+455.64 mln
1.24%
jan 1, 1968
38.125 bln
+1.039 bln
2.8%
jan 1, 1969
35.983 bln
-2.142 bln
-5.62%
jan 1, 1970
33.817 bln
-2.166 bln
-6.02%
jan 1, 1971
34.611 bln
+793.89 mln
2.35%
jan 1, 1972
35.498 bln
+887.0 mln
2.56%
jan 1, 1973
33.765 bln
-1.733 bln
-4.88%
jan 1, 1974
40.369 bln
+6.604 bln
19.56%
jan 1, 1975
51.109 bln
+10.74 bln
26.61%
jan 1, 1976
59.57 bln
+8.461 bln
16.55%
jan 1, 1977
55.533 bln
-4.037 bln
-6.78%
jan 1, 1978
52.894 bln
-2.639 bln
-4.75%
jan 1, 1979
54.621 bln
+1.726 bln
3.26%
jan 1, 1980
58.26 bln
+3.639 bln
6.66%
jan 1, 1981
63.854 bln
+5.595 bln
9.6%
jan 1, 1982
65.25 bln
+1.395 bln
2.19%
jan 1, 1983
62.46 bln
-2.789 bln
-4.27%
jan 1, 1984
58.189 bln
-4.271 bln
-6.84%
jan 1, 1985
60.422 bln
+2.233 bln
3.84%
jan 1, 1986
63.668 bln
+3.245 bln
5.37%
jan 1, 1987
60.246 bln
-3.422 bln
-5.37%
jan 1, 1988
58.206 bln
-2.039 bln
-3.38%
jan 1, 1989
58.305 bln
+98.54 mln
0.17%
jan 1, 1990
61.497 bln
+3.193 bln
5.48%
jan 1, 1991
77.368 bln
+15.871 bln
25.81%
jan 1, 1992
81.044 bln
+3.676 bln
4.75%
jan 1, 1993
72.962 bln
-8.082 bln
-9.97%
jan 1, 1994
67.85 bln
-5.113 bln
-7.01%
jan 1, 1995
71.734 bln
+3.885 bln
5.73%
jan 1, 1996
65.931 bln
-5.804 bln
-8.09%
jan 1, 1997
59.125 bln
-6.806 bln
-10.32%
jan 1, 1998
55.911 bln
-3.214 bln
-5.44%
jan 1, 1999
60.163 bln
+4.252 bln
7.6%
jan 1, 2000
61.79 bln
+1.627 bln
2.7%
jan 1, 2001
60.493 bln
-1.297 bln
-2.1%
jan 1, 2002
68.057 bln
+7.564 bln
12.5%
jan 1, 2003
72.717 bln
+4.66 bln
6.85%
jan 1, 2004
74.312 bln
+1.595 bln
2.19%
jan 1, 2005
75.71 bln
+1.398 bln
1.88%
jan 1, 2006
100.764 bln
+25.054 bln
33.09%
jan 1, 2007
93.704 bln
-7.06 bln
-7.01%
jan 1, 2008
83.861 bln
-9.843 bln
-10.5%
jan 1, 2009
89.104 bln
+5.243 bln
6.25%
jan 1, 2010
90.874 bln
+1.77 bln
1.99%
jan 1, 2011
91.105 bln
+230.54 mln
0.25%
jan 1, 2012
92.743 bln
+1.638 bln
1.8%
jan 1, 2013
91.806 bln
-936.58 mln
-1.01%
jan 1, 2014
101.645 bln
+9.839 bln
10.72%
jan 1, 2015
99.337 bln
-2.308 bln
-2.27%
Ranking of countries by current statistics by years


Comments: