29
/
en
AIzaSyAYiBZKx7MnpbEhh9jyipgxe19OcubqV5w
April 1, 2024
37235
IDA & IBRD total
IBT
false
2
1
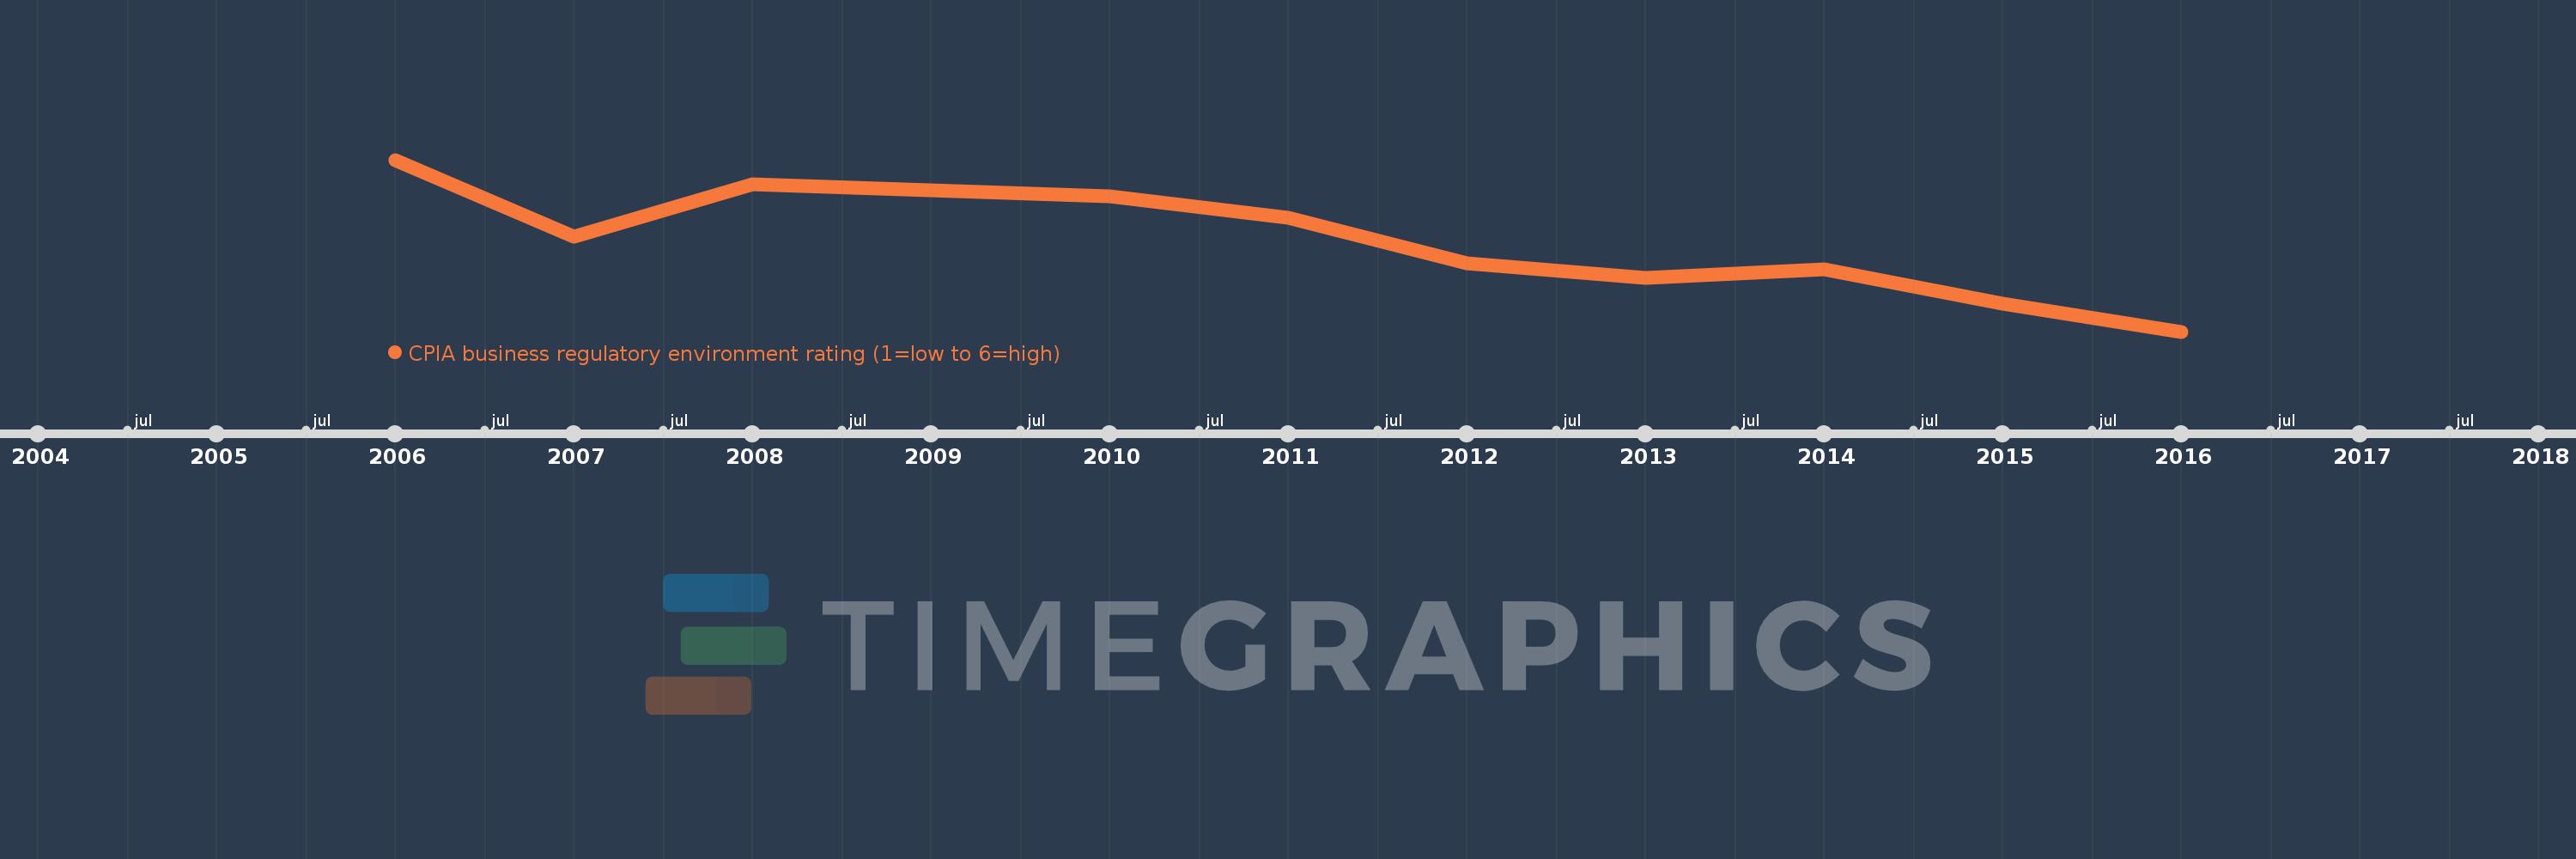
CPIA business regulatory environment rating (1=low to 6=high)
2016,2015,2014,2013,2012,2011,2010,2009,2008,2007,2006
This statistics in other country:
Timeline:
This timeline shows a graph from 2006 to 2016 of IDA & IBRD total. No data until 2005. Number of actual observations by date: 11.
Source name:
World Development Indicators
Source organization:
World Bank Group, CPIA database (http://www.worldbank.org/ida).
Categories, topics:
Public Sector
Last updated:
apr 23, 2017
Indicators value changes by year
At the date of observation
Value
Absolute change
Change from previous value
jan 1, 2006
3.309
+3.309
0.0%
jan 1, 2007
3.218
-0.091
-2.76%
jan 1, 2008
3.28
+0.062
1.93%
jan 1, 2009
3.273
-0.007
-0.2%
jan 1, 2010
3.266
-0.007
-0.22%
jan 1, 2011
3.24
-0.026
-0.8%
jan 1, 2012
3.186
-0.054
-1.68%
jan 1, 2013
3.169
-0.017
-0.54%
jan 1, 2014
3.179
+0.01
0.32%
jan 1, 2015
3.138
-0.041
-1.29%
jan 1, 2016
3.105
-0.033
-1.05%
Ranking of countries by current statistics by years


Comments: