29
/
en
AIzaSyAYiBZKx7MnpbEhh9jyipgxe19OcubqV5w
April 1, 2024
37038
IBRD only
IBD
false
2
1
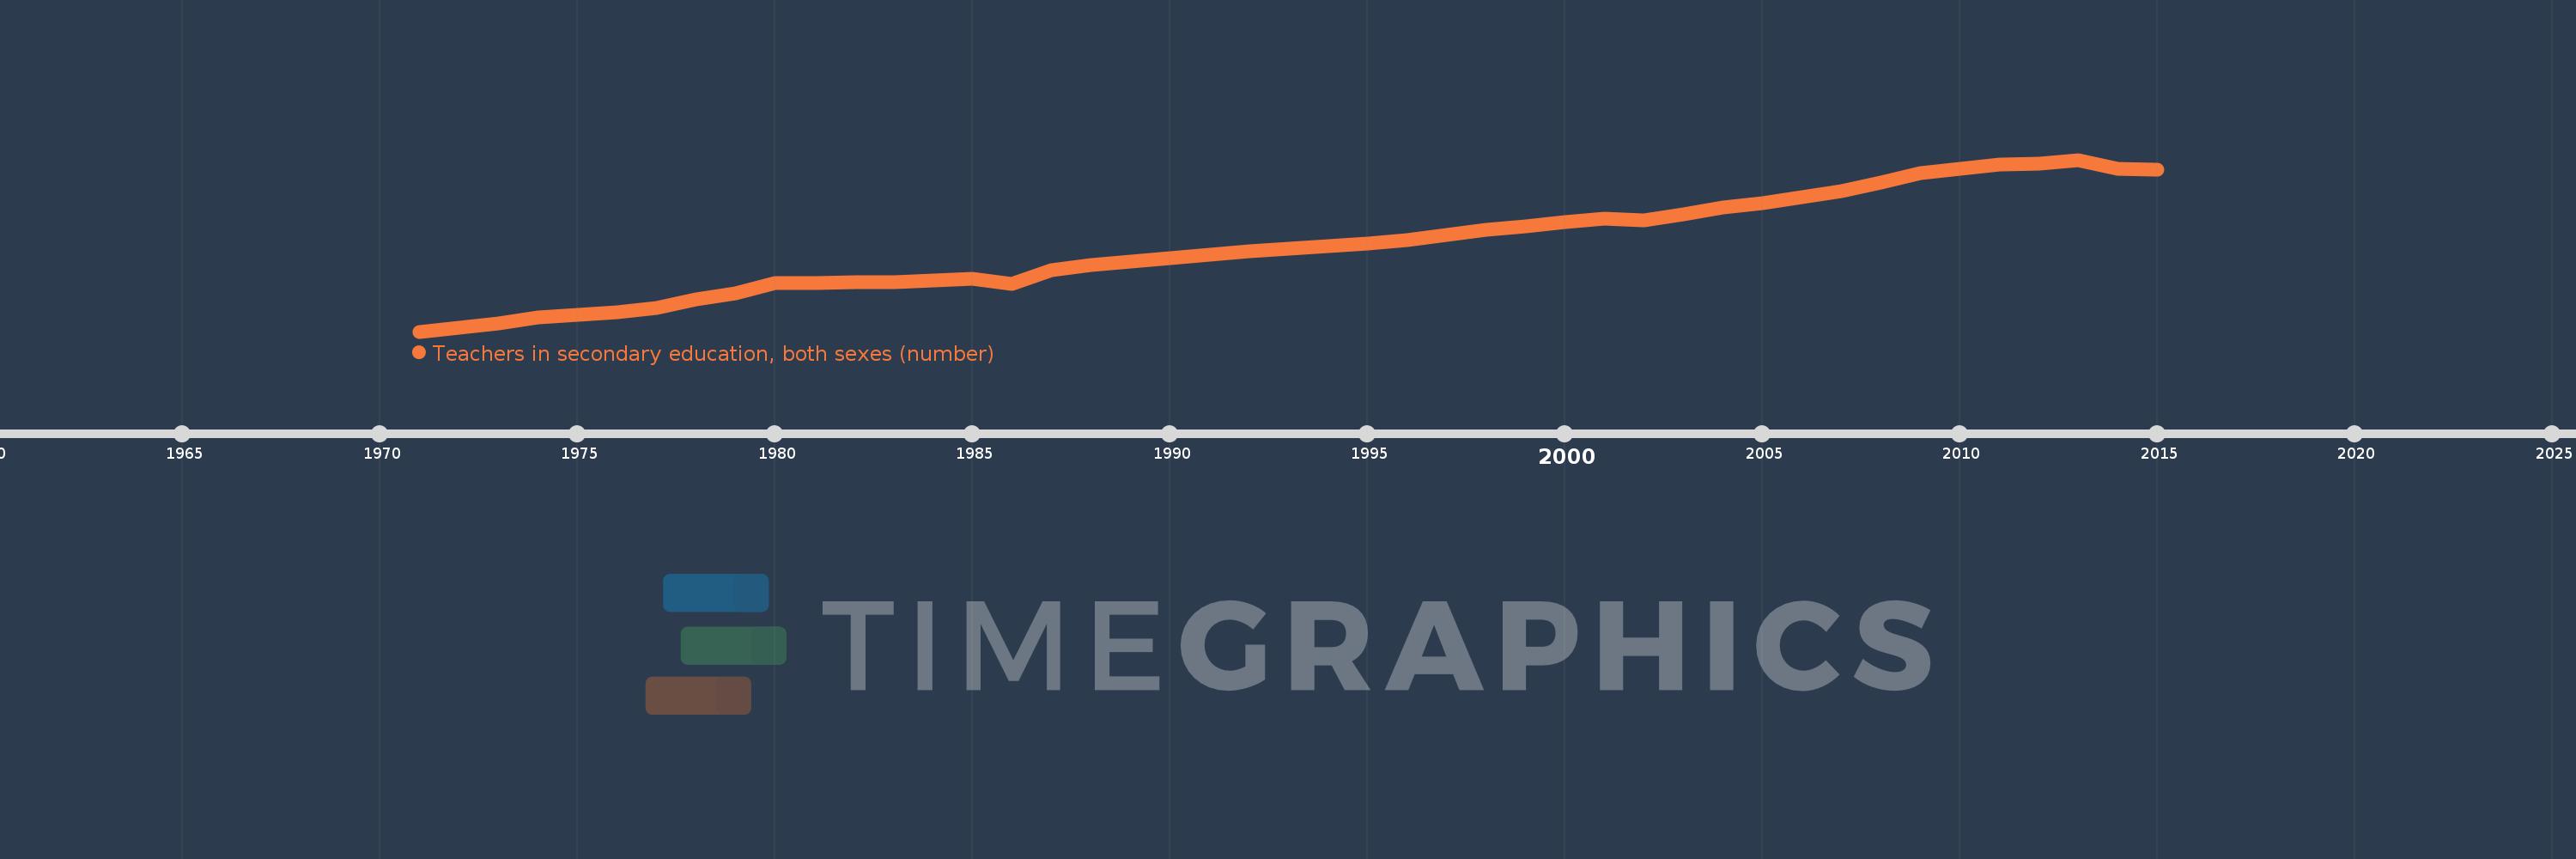
Teachers in secondary education, both sexes (number)
2015,2014,2013,2012,2011,2010,2009,2008,2007,2006,2005,2004,2003,2002,2001,2000,1999,1998,1997,1996,1995,1994,1993,1992,1991,1990,1989,1988,1987,1986,1985,1984,1983,1982,1981,1980,1979,1978,1977,1976,1975,1974,1973,1972,1971
This statistics in other country:
AfghanistanAlbaniaAlgeriaAmerican SamoaAndorraAngolaAntigua and BarbudaArab WorldArgentinaArmeniaArubaAustraliaAustriaBahamas, TheBahrainBangladeshBarbadosBelarusBelgiumBelizeBeninBermudaBhutanBoliviaBosnia and HerzegovinaBotswanaBrazilBritish Virgin IslandsBrunei DarussalamBulgariaBurkina FasoBurundiCabo VerdeCambodiaCameroonCanadaCaribbean small statesCayman IslandsCentral African RepublicCentral Europe and the BalticsChadChileChinaColombiaComorosCongo, Dem. Rep.Congo, Rep.Costa RicaCote d'IvoireCroatiaCubaCyprusCzech RepublicDenmarkDjiboutiDominicaDominican RepublicEarly-demographic dividendEast Asia & PacificEast Asia & Pacific (excluding high income)East Asia & Pacific (IDA & IBRD countries)EcuadorEgypt, Arab Rep.El SalvadorEquatorial GuineaEritreaEstoniaEthiopiaEuro areaEurope & Central AsiaEurope & Central Asia (excluding high income)Europe & Central Asia (IDA & IBRD countries)European UnionFijiFinlandFragile and conflict affected situationsFranceFrench PolynesiaGabonGambia, TheGeorgiaGermanyGhanaGibraltarGreeceGrenadaGuamGuatemalaGuineaGuinea-BissauGuyanaHaitiHeavily indebted poor countries (HIPC)High incomeHondurasHong Kong SAR, ChinaHungaryIBRD onlyIcelandIDA & IBRD totalIDA blendIDA onlyIDA totalIndiaIndonesiaIran, Islamic Rep.IraqIrelandIsraelItalyJamaicaJapanJordanKazakhstanKenyaKiribatiKorea, Dem. People’s Rep.Korea, Rep.KuwaitKyrgyz RepublicLao PDRLate-demographic dividendLatin America & Caribbean Latin America & Caribbean (excluding high income)Latin America & the Caribbean (IDA & IBRD countries)LatviaLeast developed countries: UN classificationLebanonLesothoLiberiaLibyaLiechtensteinLithuaniaLow & middle incomeLow incomeLower middle incomeLuxembourgMacao SAR, ChinaMacedonia, FYRMadagascarMalawiMalaysiaMaldivesMaliMaltaMarshall IslandsMauritaniaMauritiusMexicoMiddle East & North AfricaMiddle East & North Africa (excluding high income)Middle East & North Africa (IDA & IBRD countries)Middle incomeMoldovaMonacoMongoliaMoroccoMozambiqueMyanmarNamibiaNauruNepalNetherlandsNew CaledoniaNew ZealandNicaraguaNigerNigeriaNorth AmericaNorwayOECD membersOmanOther small statesPacific island small statesPakistanPalauPanamaPapua New GuineaParaguayPeruPhilippinesPolandPortugalPost-demographic dividendPre-demographic dividendPuerto RicoQatarRomaniaRussian FederationRwandaSamoaSan MarinoSao Tome and PrincipeSaudi ArabiaSenegalSerbiaSeychellesSierra LeoneSingaporeSint Maarten (Dutch part)Slovak RepublicSloveniaSmall statesSolomon IslandsSomaliaSouth AfricaSouth AsiaSouth Asia (IDA & IBRD)SpainSri LankaSt. Kitts and NevisSt. LuciaSt. Vincent and the GrenadinesSub-Saharan Africa Sub-Saharan Africa (excluding high income)Sub-Saharan Africa (IDA & IBRD countries)SudanSurinameSwazilandSwedenSwitzerlandSyrian Arab RepublicTajikistanTanzaniaThailandTimor-LesteTogoTongaTrinidad and TobagoTunisiaTurkeyTurks and Caicos IslandsUgandaUkraineUnited Arab EmiratesUnited KingdomUnited StatesUpper middle incomeUruguayUzbekistanVanuatuVenezuela, RBVietnamVirgin Islands (U.S.)West Bank and GazaWorldYemen, Rep.ZambiaZimbabwe Timeline:
This timeline shows a graph from 1971 to 2015 of IBRD only. No data until 1970. Number of actual observations by date: 45.
Source name:
World Development Indicators
Source organization:
UNESCO Institute for Statistics
Categories, topics:
Education
Last updated:
apr 23, 2017
Indicators value changes by year
Minimum:
6.502 mln
jan 1, 1971
Maximum:
21.678 mln
jan 1, 2013
At the date of observation
Value
Absolute change
Change from previous value
jan 1, 1971
6.502 mln
+6.502 mln
0.0%
jan 1, 1972
6.845 mln
+342.952K
5.27%
jan 1, 1973
7.242 mln
+396.281K
5.79%
jan 1, 1974
7.734 mln
+492.675K
6.8%
jan 1, 1975
7.983 mln
+249.082K
3.22%
jan 1, 1976
8.187 mln
+203.196K
2.55%
jan 1, 1977
8.615 mln
+428.677K
5.24%
jan 1, 1978
9.359 mln
+743.796K
8.63%
jan 1, 1979
9.896 mln
+536.798K
5.74%
jan 1, 1980
10.763 mln
+867.567K
8.77%
jan 1, 1981
10.754 mln
-8.908K
-0.08%
jan 1, 1982
10.867 mln
+113.05K
1.05%
jan 1, 1983
10.843 mln
-24.575K
-0.23%
jan 1, 1984
10.991 mln
+148.008K
1.37%
jan 1, 1985
11.181 mln
+189.889K
1.73%
jan 1, 1986
10.741 mln
-440.292K
-3.94%
jan 1, 1987
11.946 mln
+1.205 mln
11.22%
jan 1, 1988
12.371 mln
+425.022K
3.56%
jan 1, 1989
12.718 mln
+347.631K
2.81%
jan 1, 1990
12.975 mln
+256.184K
2.01%
jan 1, 1991
13.33 mln
+355.776K
2.74%
jan 1, 1992
13.618 mln
+287.467K
2.16%
jan 1, 1993
13.818 mln
+199.775K
1.47%
jan 1, 1994
14.078 mln
+260.189K
1.88%
jan 1, 1995
14.302 mln
+224.406K
1.59%
jan 1, 1996
14.588 mln
+286.084K
2.0%
jan 1, 1997
15.066 mln
+477.229K
3.27%
jan 1, 1998
15.467 mln
+401.977K
2.67%
jan 1, 1999
15.826 mln
+358.026K
2.31%
jan 1, 2000
16.183 mln
+357.707K
2.26%
jan 1, 2001
16.493 mln
+309.539K
1.91%
jan 1, 2002
16.334 mln
-158.886K
-0.96%
jan 1, 2003
16.845 mln
+511.23K
3.13%
jan 1, 2004
17.492 mln
+646.628K
3.84%
jan 1, 2005
17.854 mln
+362.146K
2.07%
jan 1, 2006
18.401 mln
+546.624K
3.06%
jan 1, 2007
18.886 mln
+485.076K
2.64%
jan 1, 2008
19.678 mln
+792.008K
4.19%
jan 1, 2009
20.482 mln
+804.268K
4.09%
jan 1, 2010
20.871 mln
+389.394K
1.9%
jan 1, 2011
21.26 mln
+388.946K
1.86%
jan 1, 2012
21.356 mln
+95.594K
0.45%
jan 1, 2013
21.678 mln
+322.492K
1.51%
jan 1, 2014
20.856 mln
-822.39K
-3.79%
jan 1, 2015
20.839 mln
-17.318K
-0.08%
Ranking of countries by current statistics by years


Comments: