29
/
en
AIzaSyAYiBZKx7MnpbEhh9jyipgxe19OcubqV5w
April 1, 2024
36652
IBRD only
IBD
false
2
1
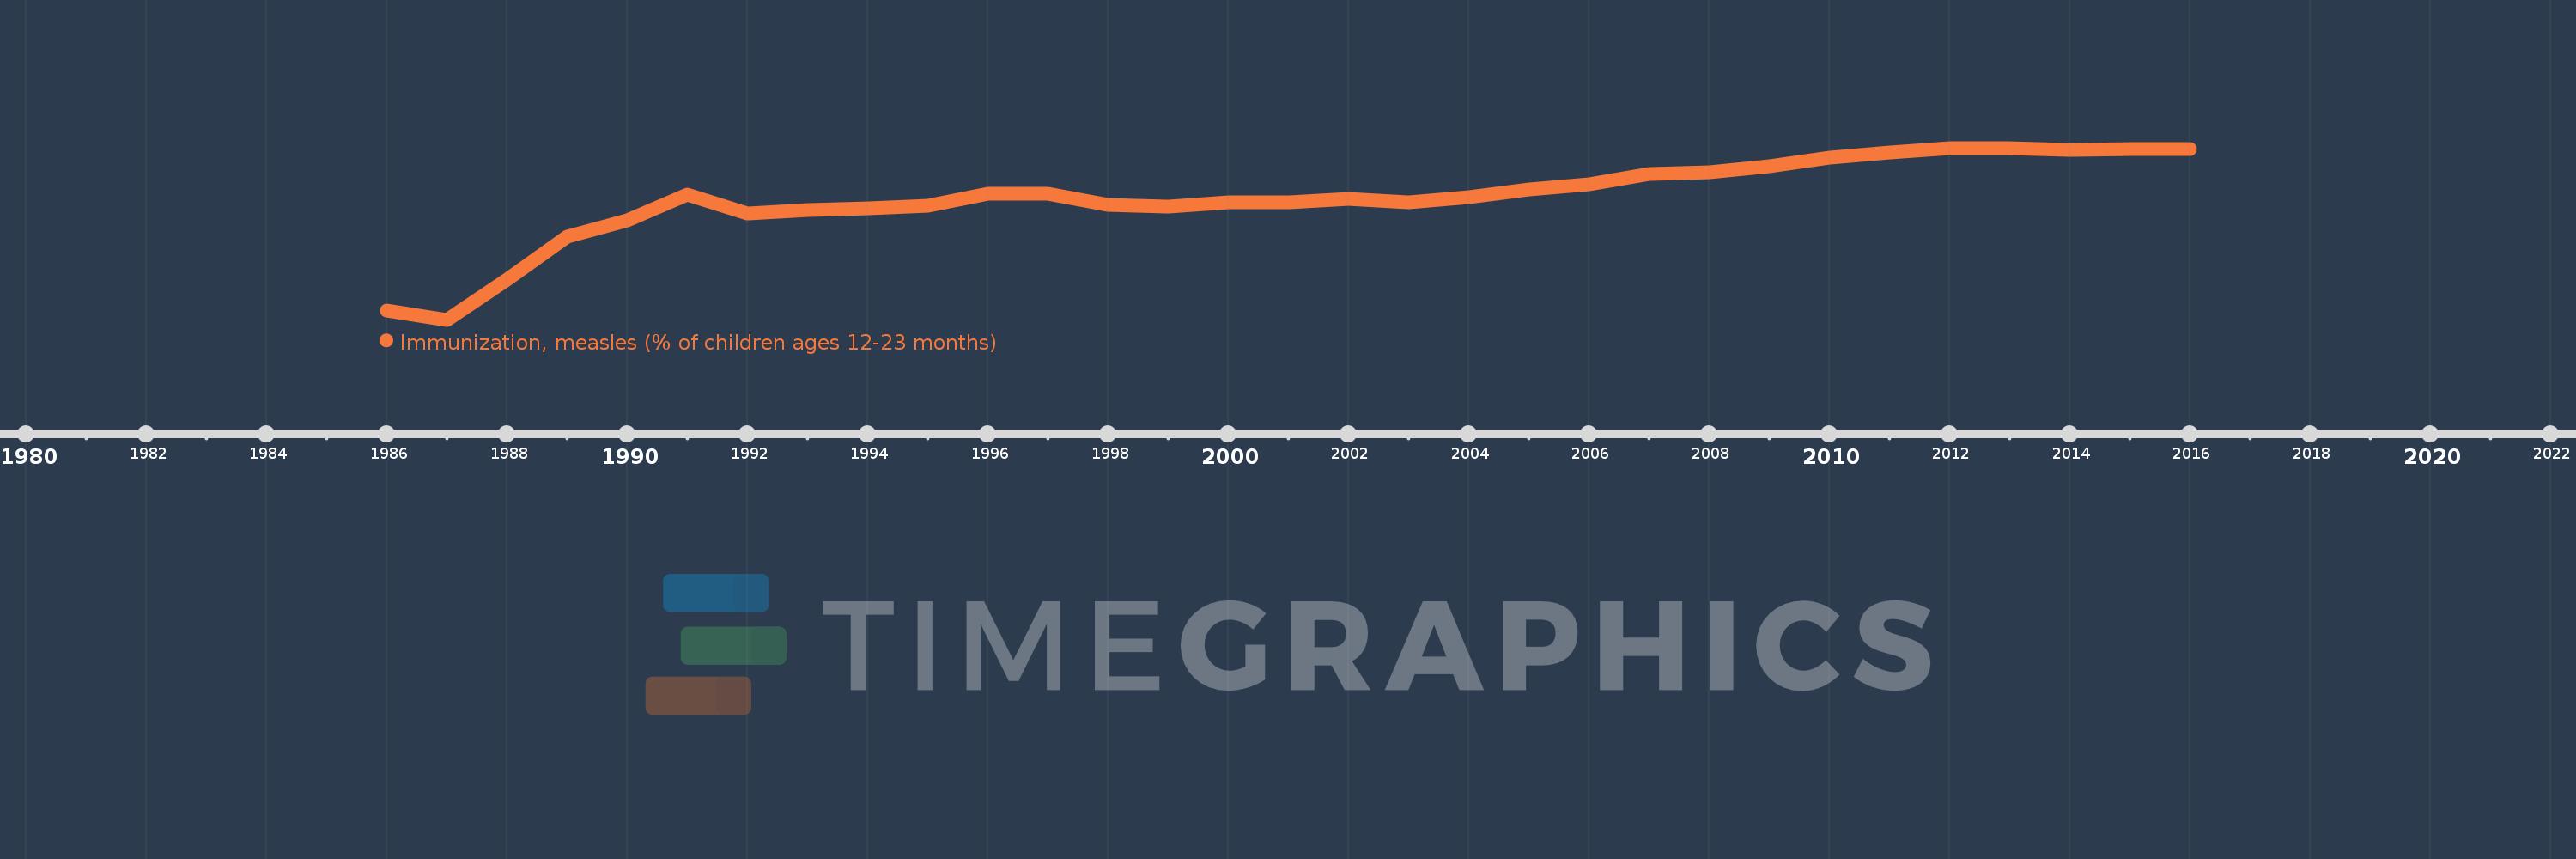
Immunization, measles (% of children ages 12-23 months)
2016,2015,2014,2013,2012,2011,2010,2009,2008,2007,2006,2005,2004,2003,2002,2001,2000,1999,1998,1997,1996,1995,1994,1993,1992,1991,1990,1989,1988,1987,1986
This statistics in other country:
AfghanistanAlbaniaAlgeriaAndorraAngolaAntigua and BarbudaArab WorldArgentinaArmeniaAustraliaAustriaAzerbaijanBahamas, TheBahrainBangladeshBarbadosBelarusBelgiumBelizeBeninBhutanBoliviaBosnia and HerzegovinaBotswanaBrazilBrunei DarussalamBulgariaBurkina FasoBurundiCabo VerdeCambodiaCameroonCanadaCaribbean small statesCentral African RepublicCentral Europe and the BalticsChadChileChinaColombiaComorosCongo, Dem. Rep.Congo, Rep.Costa RicaCote d'IvoireCroatiaCubaCyprusCzech RepublicDenmarkDjiboutiDominicaDominican RepublicEarly-demographic dividendEast Asia & PacificEast Asia & Pacific (excluding high income)East Asia & Pacific (IDA & IBRD countries)EcuadorEgypt, Arab Rep.El SalvadorEquatorial GuineaEritreaEstoniaEthiopiaEuro areaEurope & Central AsiaEurope & Central Asia (excluding high income)Europe & Central Asia (IDA & IBRD countries)European UnionFijiFinlandFragile and conflict affected situationsFranceGabonGambia, TheGeorgiaGermanyGhanaGreeceGrenadaGuatemalaGuineaGuinea-BissauGuyanaHaitiHeavily indebted poor countries (HIPC)High incomeHondurasHungaryIBRD onlyIcelandIDA & IBRD totalIDA blendIDA onlyIDA totalIndiaIndonesiaIran, Islamic Rep.IraqIrelandIsraelItalyJamaicaJapanJordanKazakhstanKenyaKiribatiKorea, Dem. People’s Rep.Korea, Rep.KuwaitKyrgyz RepublicLao PDRLate-demographic dividendLatin America & Caribbean Latin America & Caribbean (excluding high income)Latin America & the Caribbean (IDA & IBRD countries)LatviaLeast developed countries: UN classificationLebanonLesothoLiberiaLibyaLithuaniaLow & middle incomeLow incomeLower middle incomeLuxembourgMacedonia, FYRMadagascarMalawiMalaysiaMaldivesMaliMaltaMarshall IslandsMauritaniaMauritiusMexicoMicronesia, Fed. Sts.Middle East & North AfricaMiddle East & North Africa (excluding high income)Middle East & North Africa (IDA & IBRD countries)Middle incomeMoldovaMonacoMongoliaMontenegroMoroccoMozambiqueMyanmarNamibiaNauruNepalNetherlandsNew ZealandNicaraguaNigerNigeriaNorth AmericaNorwayOECD membersOmanOther small statesPacific island small statesPakistanPalauPanamaPapua New GuineaParaguayPeruPhilippinesPolandPortugalPost-demographic dividendPre-demographic dividendQatarRomaniaRussian FederationRwandaSamoaSan MarinoSao Tome and PrincipeSaudi ArabiaSenegalSerbiaSeychellesSierra LeoneSingaporeSlovak RepublicSloveniaSmall statesSolomon IslandsSomaliaSouth AfricaSouth AsiaSouth Asia (IDA & IBRD)South SudanSpainSri LankaSt. Kitts and NevisSt. LuciaSt. Vincent and the GrenadinesSub-Saharan Africa Sub-Saharan Africa (excluding high income)Sub-Saharan Africa (IDA & IBRD countries)SudanSurinameSwazilandSwedenSwitzerlandSyrian Arab RepublicTajikistanTanzaniaThailandTimor-LesteTogoTongaTrinidad and TobagoTunisiaTurkeyTurkmenistanTuvaluUgandaUkraineUnited Arab EmiratesUnited KingdomUnited StatesUpper middle incomeUruguayUzbekistanVanuatuVenezuela, RBVietnamWorldYemen, Rep.ZambiaZimbabwe Timeline:
This timeline shows a graph from 1986 to 2016 of IBRD only. No data until 1985. Number of actual observations by date: 31.
Source name:
World Development Indicators
Source organization:
WHO and UNICEF (http://www.who.int/immunization/monitoring_surveillance/en/).
Categories, topics:
Health
Last updated:
apr 23, 2017
Indicators value changes by year
Minimum:
44.798
jan 1, 1987
Maximum:
89.887
jan 1, 2013
At the date of observation
Value
Absolute change
Change from previous value
jan 1, 1986
47.265
+47.265
0.0%
jan 1, 1987
44.798
-2.467
-5.22%
jan 1, 1988
55.391
+10.593
23.65%
jan 1, 1989
66.569
+11.179
20.18%
jan 1, 1990
70.786
+4.216
6.33%
jan 1, 1991
77.596
+6.81
9.62%
jan 1, 1992
72.73
-4.866
-6.27%
jan 1, 1993
73.635
+0.905
1.24%
jan 1, 1994
74.085
+0.45
0.61%
jan 1, 1995
74.746
+0.661
0.89%
jan 1, 1996
77.982
+3.236
4.33%
jan 1, 1997
77.805
-0.177
-0.23%
jan 1, 1998
74.962
-2.843
-3.65%
jan 1, 1999
74.485
-0.476
-0.64%
jan 1, 2000
75.616
+1.131
1.52%
jan 1, 2001
75.614
-0.002
0.0%
jan 1, 2002
76.586
+0.972
1.29%
jan 1, 2003
75.536
-1.05
-1.37%
jan 1, 2004
77.017
+1.481
1.96%
jan 1, 2005
78.905
+1.888
2.45%
jan 1, 2006
80.457
+1.551
1.97%
jan 1, 2007
83.028
+2.571
3.2%
jan 1, 2008
83.538
+0.511
0.62%
jan 1, 2009
85.019
+1.48
1.77%
jan 1, 2010
87.431
+2.412
2.84%
jan 1, 2011
88.773
+1.342
1.53%
jan 1, 2012
89.777
+1.005
1.13%
jan 1, 2013
89.887
+0.11
0.12%
jan 1, 2014
89.367
-0.52
-0.58%
jan 1, 2015
89.485
+0.117
0.13%
jan 1, 2016
89.534
+0.05
0.06%
Ranking of countries by current statistics by years


Comments: