29
/
en
AIzaSyAYiBZKx7MnpbEhh9jyipgxe19OcubqV5w
April 1, 2024
36649
IBRD only
IBD
false
2
1
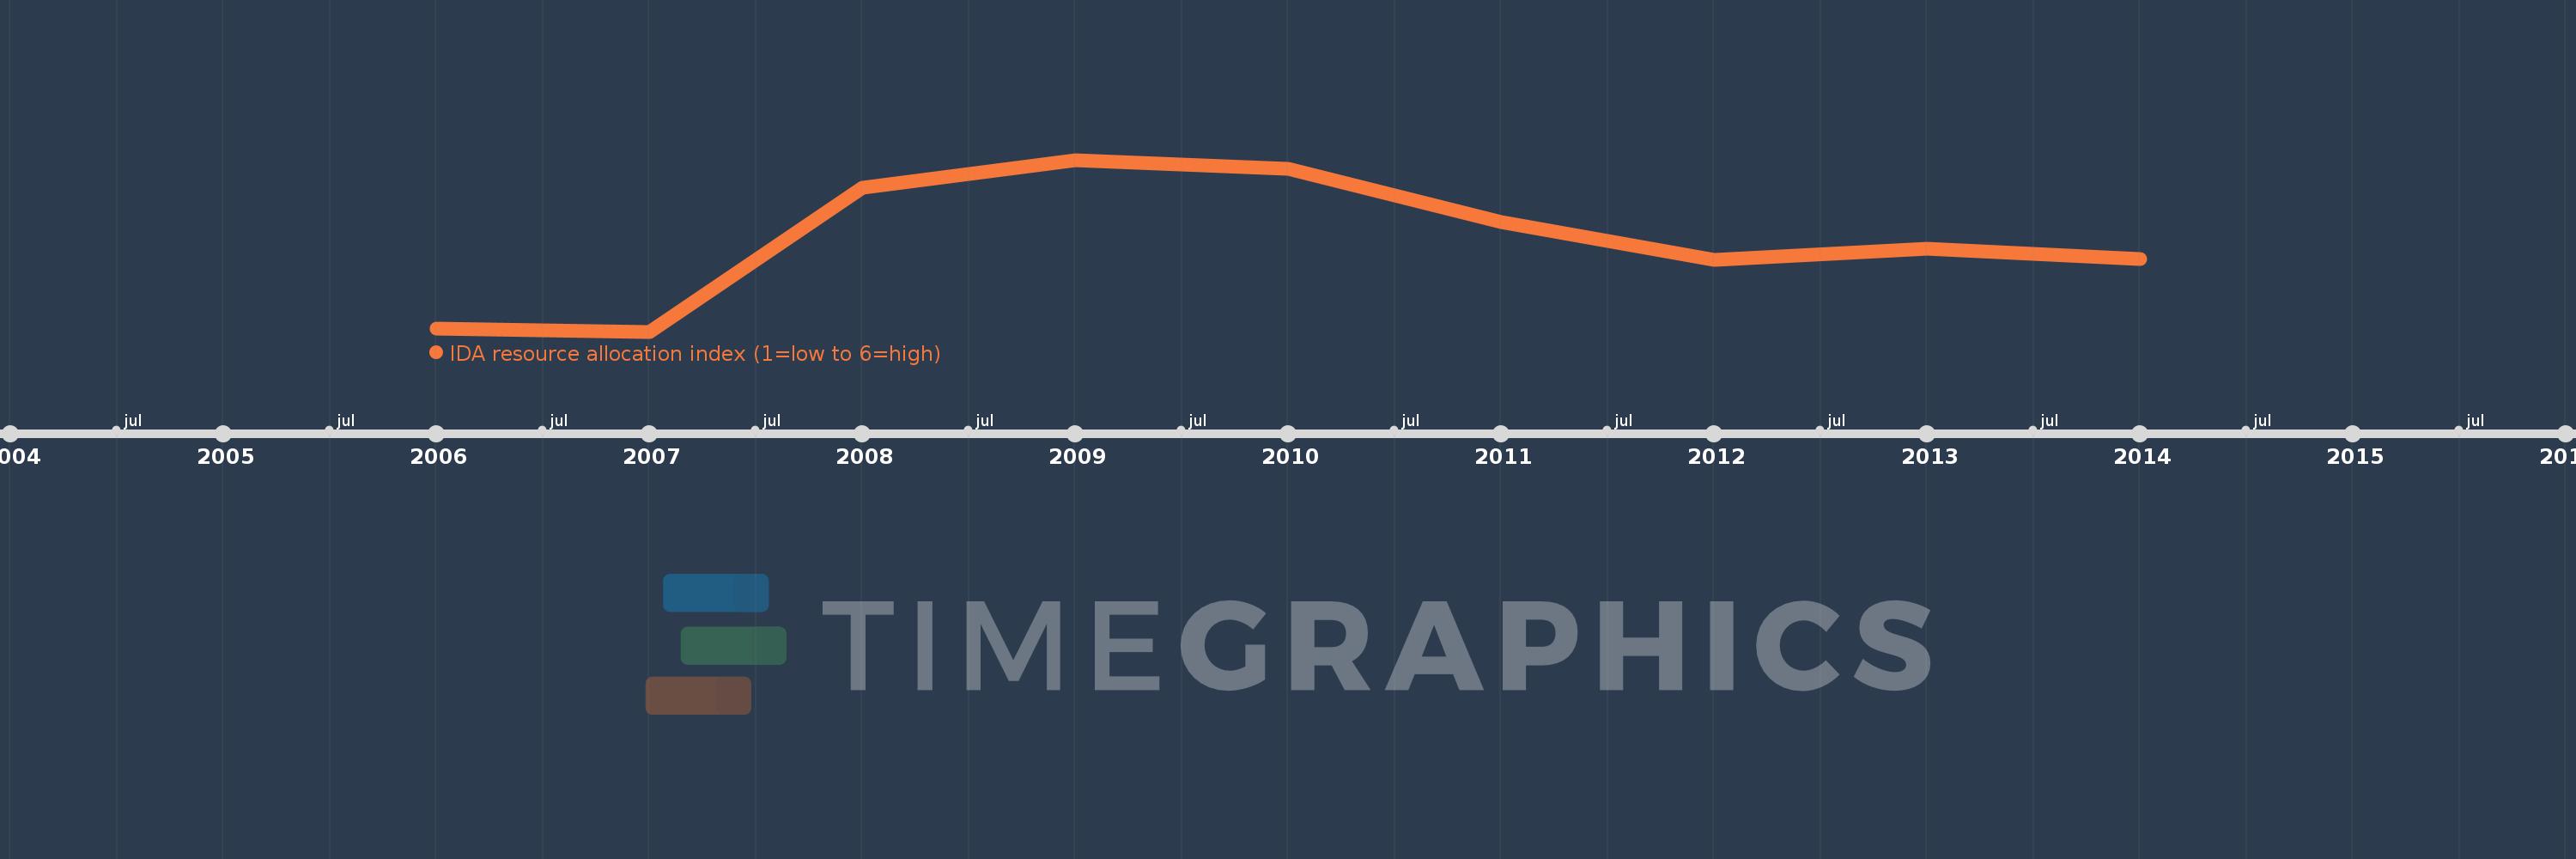
IDA resource allocation index (1=low to 6=high)
2014,2013,2012,2011,2010,2009,2008,2007,2006
This statistics in other country:
Timeline:
This timeline shows a graph from 2006 to 2014 of IBRD only. No data until 2005. Number of actual observations by date: 9.
Source name:
World Development Indicators
Source organization:
World Bank Group, CPIA database (http://www.worldbank.org/ida).
Categories, topics:
Public Sector
Last updated:
apr 23, 2017
Indicators value changes by year
At the date of observation
Value
Absolute change
Change from previous value
jan 1, 2006
3.643
+3.643
0.0%
jan 1, 2007
3.64
-0.003
-0.08%
jan 1, 2008
3.774
+0.134
3.68%
jan 1, 2009
3.8
+0.026
0.7%
jan 1, 2010
3.792
-0.008
-0.22%
jan 1, 2011
3.742
-0.05
-1.32%
jan 1, 2012
3.707
-0.035
-0.94%
jan 1, 2013
3.717
+0.01
0.27%
jan 1, 2014
3.708
-0.008
-0.22%
Ranking of countries by current statistics by years


Comments: