29
/
en
AIzaSyAYiBZKx7MnpbEhh9jyipgxe19OcubqV5w
April 1, 2024
36022
High income
HIC
false
2
1
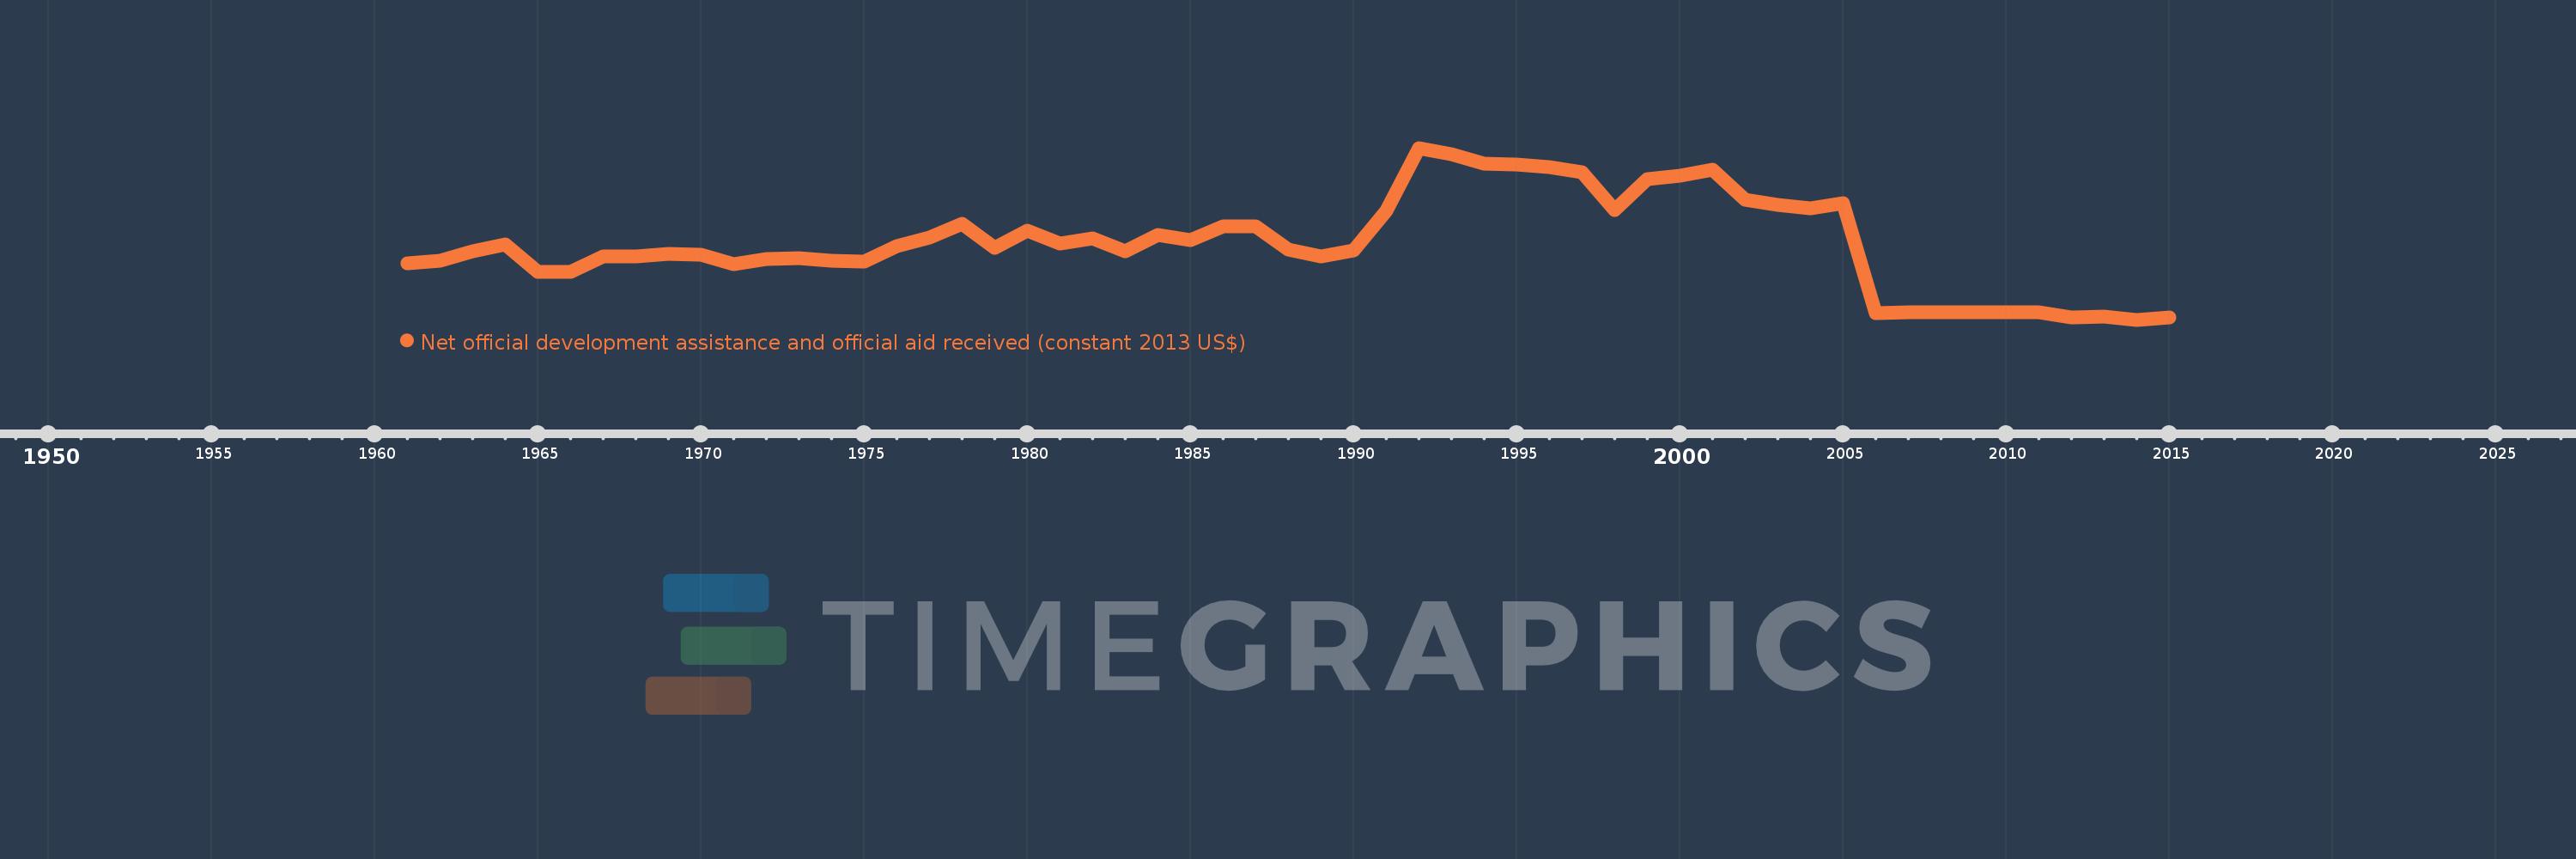
Net official development assistance and official aid received (constant 2013 US$)
2015,2014,2013,2012,2011,2010,2009,2008,2007,2006,2005,2004,2003,2002,2001,2000,1999,1998,1997,1996,1995,1994,1993,1992,1991,1990,1989,1988,1987,1986,1985,1984,1983,1982,1981,1980,1979,1978,1977,1976,1975,1974,1973,1972,1971,1970,1969,1968,1967,1966,1965,1964,1963,1962,1961
This statistics in other country:
AfghanistanAlbaniaAlgeriaAngolaAntigua and BarbudaArab WorldArgentinaArmeniaArubaAzerbaijanBahamas, TheBahrainBangladeshBarbadosBelarusBelizeBeninBermudaBhutanBoliviaBosnia and HerzegovinaBotswanaBrazilBritish Virgin IslandsBrunei DarussalamBulgariaBurkina FasoBurundiCabo VerdeCambodiaCameroonCaribbean small statesCayman IslandsCentral African RepublicCentral Europe and the BalticsChadChileChinaColombiaComorosCongo, Dem. Rep.Congo, Rep.Costa RicaCote d'IvoireCroatiaCubaCyprusCzech RepublicDjiboutiDominicaDominican RepublicEast Asia & PacificEast Asia & Pacific (excluding high income)East Asia & Pacific (IDA & IBRD countries)EcuadorEgypt, Arab Rep.El SalvadorEquatorial GuineaEritreaEstoniaEthiopiaEuro areaEurope & Central AsiaEurope & Central Asia (excluding high income)Europe & Central Asia (IDA & IBRD countries)European UnionFijiFragile and conflict affected situationsFrench PolynesiaGabonGambia, TheGeorgiaGhanaGibraltarGrenadaGuatemalaGuineaGuinea-BissauGuyanaHaitiHeavily indebted poor countries (HIPC)High incomeHondurasHong Kong SAR, ChinaHungaryIBRD onlyIDA & IBRD totalIDA blendIDA onlyIDA totalIndiaIndonesiaIran, Islamic Rep.IraqIsraelJamaicaJordanKazakhstanKenyaKiribatiKorea, Dem. People’s Rep.Korea, Rep.KosovoKuwaitKyrgyz RepublicLao PDRLatin America & Caribbean Latin America & Caribbean (excluding high income)Latin America & the Caribbean (IDA & IBRD countries)LatviaLeast developed countries: UN classificationLebanonLesothoLiberiaLibyaLithuaniaLow & middle incomeLow incomeLower middle incomeMacao SAR, ChinaMacedonia, FYRMadagascarMalawiMalaysiaMaldivesMaliMaltaMarshall IslandsMauritaniaMauritiusMexicoMicronesia, Fed. Sts.Middle East & North AfricaMiddle East & North Africa (excluding high income)Middle East & North Africa (IDA & IBRD countries)Middle incomeMoldovaMongoliaMontenegroMoroccoMozambiqueMyanmarNamibiaNauruNepalNew CaledoniaNicaraguaNigerNigeriaNorth AmericaNorthern Mariana IslandsOECD membersOmanOther small statesPacific island small statesPakistanPalauPanamaPapua New GuineaParaguayPeruPhilippinesPolandQatarRomaniaRussian FederationRwandaSamoaSao Tome and PrincipeSaudi ArabiaSenegalSerbiaSeychellesSierra LeoneSingaporeSlovak RepublicSloveniaSmall statesSolomon IslandsSomaliaSouth AfricaSouth AsiaSouth Asia (IDA & IBRD)South SudanSri LankaSt. Kitts and NevisSt. LuciaSt. Vincent and the GrenadinesSub-Saharan Africa Sub-Saharan Africa (excluding high income)Sub-Saharan Africa (IDA & IBRD countries)SudanSurinameSwazilandSyrian Arab RepublicTajikistanTanzaniaThailandTimor-LesteTogoTongaTrinidad and TobagoTunisiaTurkeyTurkmenistanTurks and Caicos IslandsTuvaluUgandaUkraineUnited Arab EmiratesUpper middle incomeUruguayUzbekistanVanuatuVenezuela, RBVietnamWest Bank and GazaWorldYemen, Rep.ZambiaZimbabwe Timeline:
This timeline shows a graph from 1961 to 2015 of High income. No data until 1960. Number of actual observations by date: 55.
Source name:
World Development Indicators
Source organization:
Development Assistance Committee of the Organisation for Economic Co-operation and Development, Geographical Distribution of Financial Flows to Developing Countries, Development Co-operation Report, and International Development Statistics database. Data are available online at: www.oecd.org/dac/stats/idsonline.
Categories, topics:
Aid Effectiveness
Last updated:
apr 23, 2017
Indicators value changes by year
Minimum:
250.24 mln
jan 1, 2014
Maximum:
11.654 bln
jan 1, 1992
At the date of observation
Value
Absolute change
Change from previous value
jan 1, 1961
3.992 bln
+3.992 bln
0.0%
jan 1, 1962
4.176 bln
+184.46 mln
4.62%
jan 1, 1963
4.788 bln
+611.64 mln
14.65%
jan 1, 1964
5.223 bln
+435.06 mln
9.09%
jan 1, 1965
3.398 bln
-1.825 bln
-34.94%
jan 1, 1966
3.406 bln
+8.15 mln
0.24%
jan 1, 1967
4.448 bln
+1.042 bln
30.59%
jan 1, 1968
4.464 bln
+15.24 mln
0.34%
jan 1, 1969
4.601 bln
+137.68 mln
3.08%
jan 1, 1970
4.538 bln
-63.16 mln
-1.37%
jan 1, 1971
3.948 bln
-589.87 mln
-13.0%
jan 1, 1972
4.277 bln
+328.82 mln
8.33%
jan 1, 1973
4.351 bln
+73.94 mln
1.73%
jan 1, 1974
4.18 bln
-170.8 mln
-3.93%
jan 1, 1975
4.126 bln
-54.44 mln
-1.3%
jan 1, 1976
5.148 bln
+1.022 bln
24.78%
jan 1, 1977
5.697 bln
+548.45 mln
10.65%
jan 1, 1978
6.603 bln
+906.47 mln
15.91%
jan 1, 1979
5.034 bln
-1.569 bln
-23.76%
jan 1, 1980
6.175 bln
+1.141 bln
22.67%
jan 1, 1981
5.302 bln
-873.41 mln
-14.14%
jan 1, 1982
5.636 bln
+334.57 mln
6.31%
jan 1, 1983
4.804 bln
-832.07 mln
-14.76%
jan 1, 1984
5.868 bln
+1.064 bln
22.15%
jan 1, 1985
5.524 bln
-344.24 mln
-5.87%
jan 1, 1986
6.466 bln
+941.78 mln
17.05%
jan 1, 1987
6.467 bln
+1.09 mln
0.02%
jan 1, 1988
4.911 bln
-1.556 bln
-24.06%
jan 1, 1989
4.474 bln
-436.65 mln
-8.89%
jan 1, 1990
4.856 bln
+382.13 mln
8.54%
jan 1, 1991
7.478 bln
+2.621 bln
53.98%
jan 1, 1992
11.654 bln
+4.176 bln
55.84%
jan 1, 1993
11.252 bln
-401.42 mln
-3.44%
jan 1, 1994
10.624 bln
-627.88 mln
-5.58%
jan 1, 1995
10.527 bln
-97.19 mln
-0.91%
jan 1, 1996
10.375 bln
-152.35 mln
-1.45%
jan 1, 1997
10.013 bln
-362.1 mln
-3.49%
jan 1, 1998
7.532 bln
-2.48 bln
-24.77%
jan 1, 1999
9.568 bln
+2.035 bln
27.02%
jan 1, 2000
9.831 bln
+263.69 mln
2.76%
jan 1, 2001
10.222 bln
+390.41 mln
3.97%
jan 1, 2002
8.192 bln
-2.03 bln
-19.86%
jan 1, 2003
7.883 bln
-309.1 mln
-3.77%
jan 1, 2004
7.67 bln
-213.11 mln
-2.7%
jan 1, 2005
7.999 bln
+329.1 mln
4.29%
jan 1, 2006
683.56 mln
-7.315 bln
-91.45%
jan 1, 2007
757.91 mln
+74.35 mln
10.88%
jan 1, 2008
719.06 mln
-38.85 mln
-5.13%
jan 1, 2009
762.91 mln
+43.85 mln
6.1%
jan 1, 2010
736.6 mln
-26.31 mln
-3.45%
jan 1, 2011
744.5 mln
+7.9 mln
1.07%
jan 1, 2012
384.9 mln
-359.6 mln
-48.3%
jan 1, 2013
461.4 mln
+76.5 mln
19.88%
jan 1, 2014
250.24 mln
-211.16 mln
-45.77%
jan 1, 2015
425.89 mln
+175.65 mln
70.19%
Ranking of countries by current statistics by years


Comments: