29
/
en
AIzaSyAYiBZKx7MnpbEhh9jyipgxe19OcubqV5w
April 1, 2024
35822
High income
HIC
false
2
1
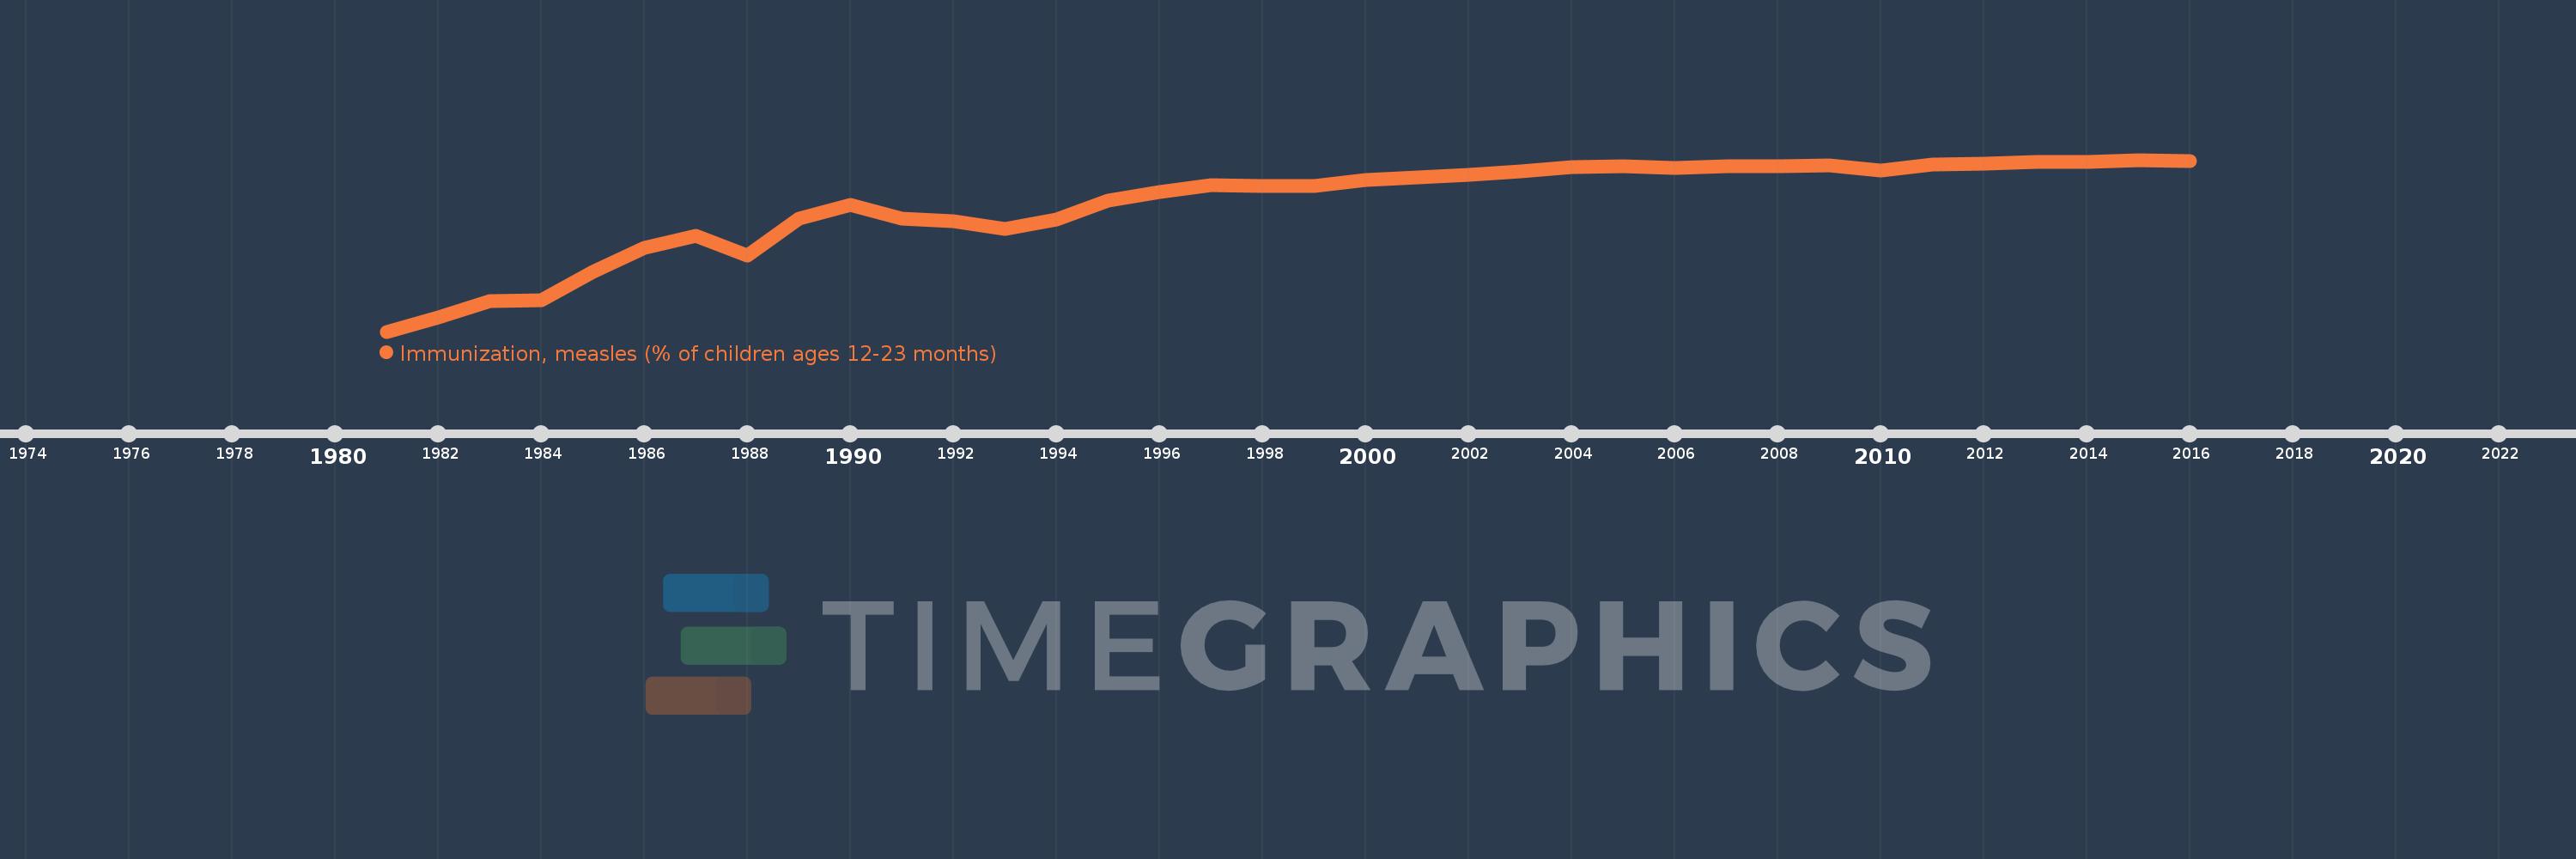
Immunization, measles (% of children ages 12-23 months)
2016,2015,2014,2013,2012,2011,2010,2009,2008,2007,2006,2005,2004,2003,2002,2001,2000,1999,1998,1997,1996,1995,1994,1993,1992,1991,1990,1989,1988,1987,1986,1985,1984,1983,1982,1981
This statistics in other country:
AfghanistanAlbaniaAlgeriaAndorraAngolaAntigua and BarbudaArab WorldArgentinaArmeniaAustraliaAustriaAzerbaijanBahamas, TheBahrainBangladeshBarbadosBelarusBelgiumBelizeBeninBhutanBoliviaBosnia and HerzegovinaBotswanaBrazilBrunei DarussalamBulgariaBurkina FasoBurundiCabo VerdeCambodiaCameroonCanadaCaribbean small statesCentral African RepublicCentral Europe and the BalticsChadChileChinaColombiaComorosCongo, Dem. Rep.Congo, Rep.Costa RicaCote d'IvoireCroatiaCubaCyprusCzech RepublicDenmarkDjiboutiDominicaDominican RepublicEarly-demographic dividendEast Asia & PacificEast Asia & Pacific (excluding high income)East Asia & Pacific (IDA & IBRD countries)EcuadorEgypt, Arab Rep.El SalvadorEquatorial GuineaEritreaEstoniaEthiopiaEuro areaEurope & Central AsiaEurope & Central Asia (excluding high income)Europe & Central Asia (IDA & IBRD countries)European UnionFijiFinlandFragile and conflict affected situationsFranceGabonGambia, TheGeorgiaGermanyGhanaGreeceGrenadaGuatemalaGuineaGuinea-BissauGuyanaHaitiHeavily indebted poor countries (HIPC)High incomeHondurasHungaryIBRD onlyIcelandIDA & IBRD totalIDA blendIDA onlyIDA totalIndiaIndonesiaIran, Islamic Rep.IraqIrelandIsraelItalyJamaicaJapanJordanKazakhstanKenyaKiribatiKorea, Dem. People’s Rep.Korea, Rep.KuwaitKyrgyz RepublicLao PDRLate-demographic dividendLatin America & Caribbean Latin America & Caribbean (excluding high income)Latin America & the Caribbean (IDA & IBRD countries)LatviaLeast developed countries: UN classificationLebanonLesothoLiberiaLibyaLithuaniaLow & middle incomeLow incomeLower middle incomeLuxembourgMacedonia, FYRMadagascarMalawiMalaysiaMaldivesMaliMaltaMarshall IslandsMauritaniaMauritiusMexicoMicronesia, Fed. Sts.Middle East & North AfricaMiddle East & North Africa (excluding high income)Middle East & North Africa (IDA & IBRD countries)Middle incomeMoldovaMonacoMongoliaMontenegroMoroccoMozambiqueMyanmarNamibiaNauruNepalNetherlandsNew ZealandNicaraguaNigerNigeriaNorth AmericaNorwayOECD membersOmanOther small statesPacific island small statesPakistanPalauPanamaPapua New GuineaParaguayPeruPhilippinesPolandPortugalPost-demographic dividendPre-demographic dividendQatarRomaniaRussian FederationRwandaSamoaSan MarinoSao Tome and PrincipeSaudi ArabiaSenegalSerbiaSeychellesSierra LeoneSingaporeSlovak RepublicSloveniaSmall statesSolomon IslandsSomaliaSouth AfricaSouth AsiaSouth Asia (IDA & IBRD)South SudanSpainSri LankaSt. Kitts and NevisSt. LuciaSt. Vincent and the GrenadinesSub-Saharan Africa Sub-Saharan Africa (excluding high income)Sub-Saharan Africa (IDA & IBRD countries)SudanSurinameSwazilandSwedenSwitzerlandSyrian Arab RepublicTajikistanTanzaniaThailandTimor-LesteTogoTongaTrinidad and TobagoTunisiaTurkeyTurkmenistanTuvaluUgandaUkraineUnited Arab EmiratesUnited KingdomUnited StatesUpper middle incomeUruguayUzbekistanVanuatuVenezuela, RBVietnamWorldYemen, Rep.ZambiaZimbabwe Timeline:
This timeline shows a graph from 1981 to 2016 of High income. No data until 1980. Number of actual observations by date: 36.
Source name:
World Development Indicators
Source organization:
WHO and UNICEF (http://www.who.int/immunization/monitoring_surveillance/en/).
Categories, topics:
Health
Last updated:
apr 23, 2017
Indicators value changes by year
Minimum:
65.171
jan 1, 1981
Maximum:
94.108
jan 1, 2015
At the date of observation
Value
Absolute change
Change from previous value
jan 1, 1981
65.171
+65.171
0.0%
jan 1, 1982
67.496
+2.325
3.57%
jan 1, 1983
70.354
+2.858
4.23%
jan 1, 1984
70.508
+0.154
0.22%
jan 1, 1985
75.227
+4.719
6.69%
jan 1, 1986
79.287
+4.06
5.4%
jan 1, 1987
81.287
+2.0
2.52%
jan 1, 1988
78.028
-3.26
-4.01%
jan 1, 1989
84.16
+6.133
7.86%
jan 1, 1990
86.514
+2.353
2.8%
jan 1, 1991
84.186
-2.328
-2.69%
jan 1, 1992
83.725
-0.461
-0.55%
jan 1, 1993
82.52
-1.204
-1.44%
jan 1, 1994
84.06
+1.54
1.87%
jan 1, 1995
87.291
+3.231
3.84%
jan 1, 1996
88.613
+1.322
1.51%
jan 1, 1997
89.901
+1.288
1.45%
jan 1, 1998
89.755
-0.147
-0.16%
jan 1, 1999
89.73
-0.025
-0.03%
jan 1, 2000
90.662
+0.932
1.04%
jan 1, 2001
91.155
+0.493
0.54%
jan 1, 2002
91.596
+0.441
0.48%
jan 1, 2003
92.099
+0.503
0.55%
jan 1, 2004
92.832
+0.733
0.8%
jan 1, 2005
93.084
+0.252
0.27%
jan 1, 2006
92.755
-0.329
-0.35%
jan 1, 2007
93.033
+0.278
0.3%
jan 1, 2008
92.994
-0.039
-0.04%
jan 1, 2009
93.108
+0.113
0.12%
jan 1, 2010
92.329
-0.779
-0.84%
jan 1, 2011
93.277
+0.948
1.03%
jan 1, 2012
93.404
+0.126
0.14%
jan 1, 2013
93.769
+0.366
0.39%
jan 1, 2014
93.738
-0.031
-0.03%
jan 1, 2015
94.108
+0.37
0.39%
jan 1, 2016
93.862
-0.246
-0.26%
Ranking of countries by current statistics by years


Comments: