29
/
en
AIzaSyAYiBZKx7MnpbEhh9jyipgxe19OcubqV5w
April 1, 2024
35594
High income
HIC
false
2
1
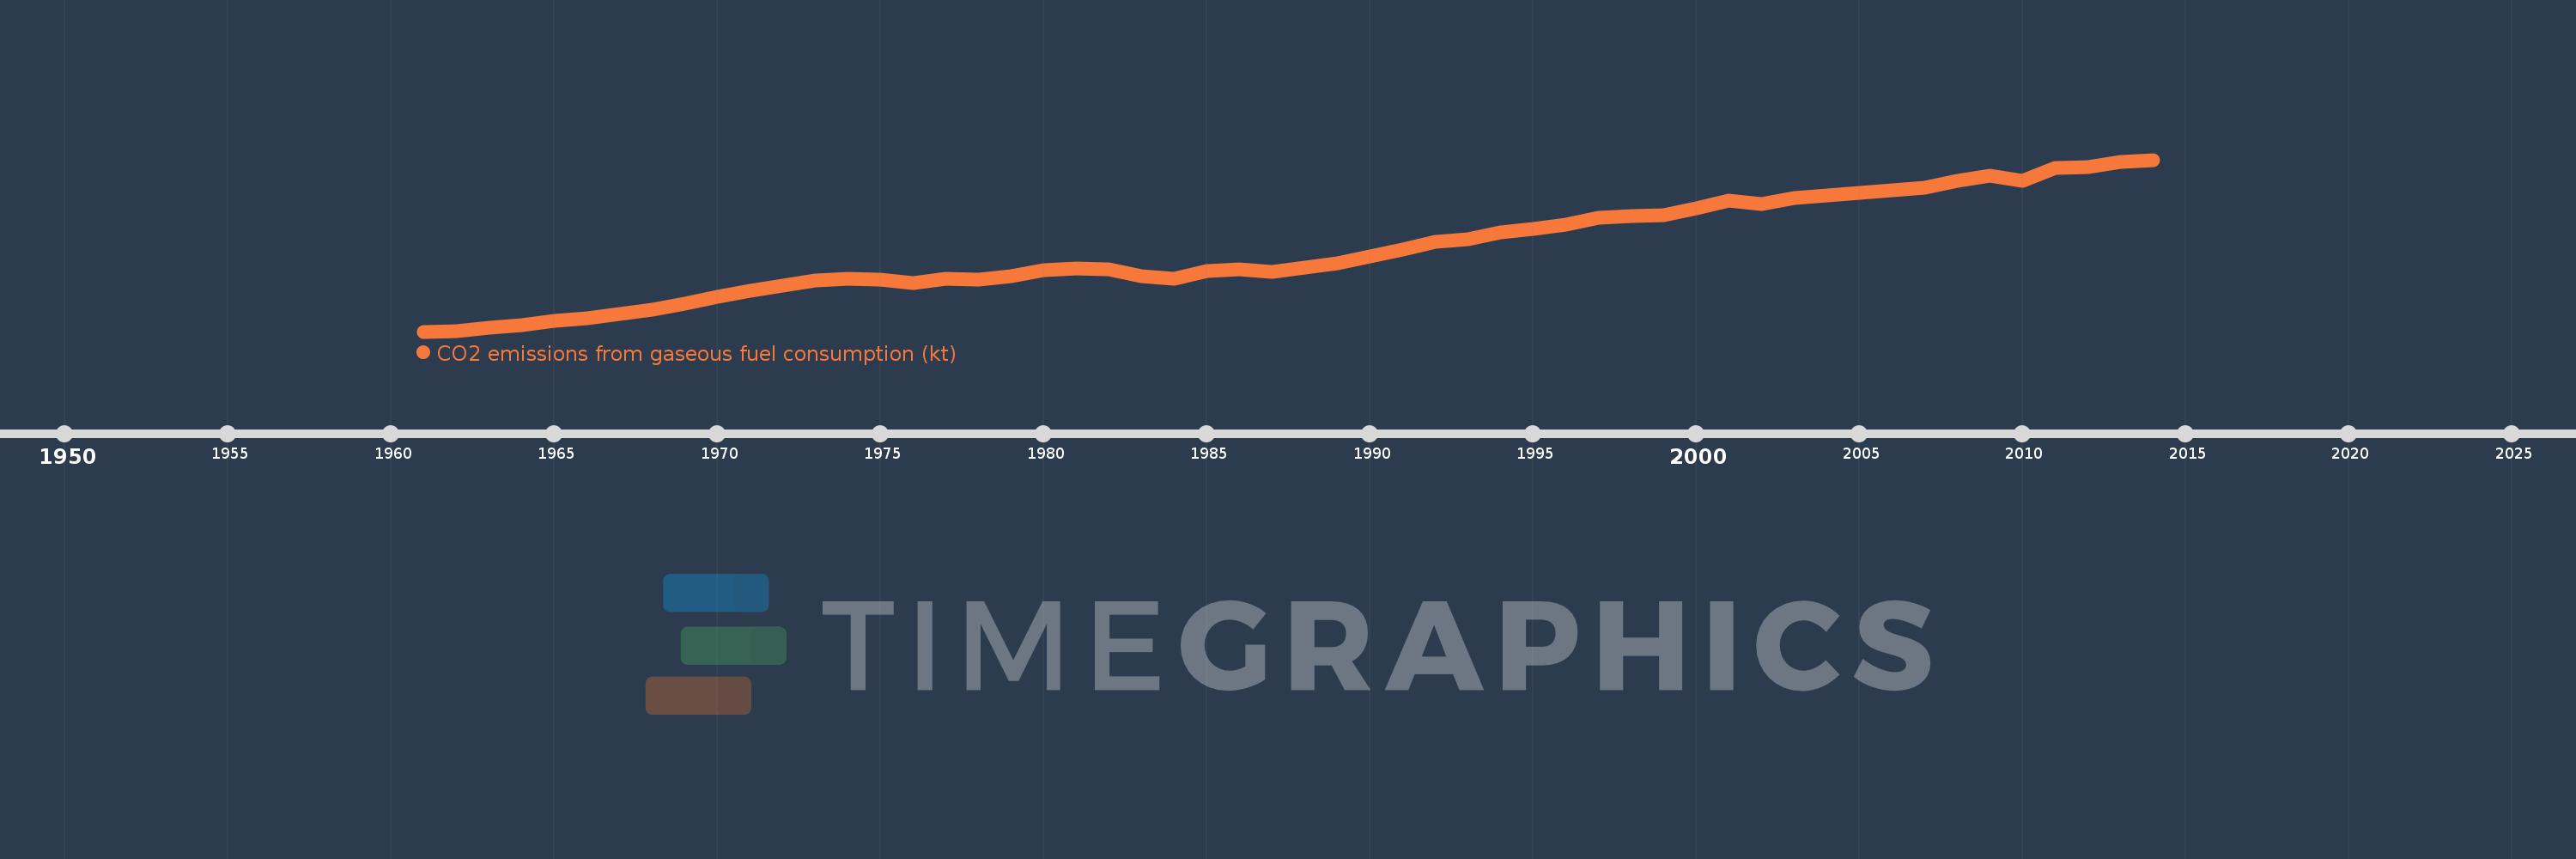
CO2 emissions from gaseous fuel consumption (kt)
2014,2013,2012,2011,2010,2009,2008,2007,2006,2005,2004,2003,2002,2001,2000,1999,1998,1997,1996,1995,1994,1993,1992,1991,1990,1989,1988,1987,1986,1985,1984,1983,1982,1981,1980,1979,1978,1977,1976,1975,1974,1973,1972,1971,1970,1969,1968,1967,1966,1965,1964,1963,1962,1961
This statistics in other country:
AfghanistanAlbaniaAlgeriaAndorraAngolaAntigua and BarbudaArab WorldArgentinaArmeniaArubaAustraliaAustriaAzerbaijanBahamas, TheBahrainBangladeshBarbadosBelarusBelgiumBelizeBeninBermudaBhutanBoliviaBosnia and HerzegovinaBotswanaBrazilBritish Virgin IslandsBrunei DarussalamBulgariaBurkina FasoBurundiCabo VerdeCambodiaCameroonCanadaCayman IslandsCentral African RepublicCentral Europe and the BalticsChadChileChinaColombiaComorosCongo, Dem. Rep.Congo, Rep.Costa RicaCote d'IvoireCroatiaCubaCuracaoCyprusCzech RepublicDenmarkDjiboutiDominicaDominican RepublicEarly-demographic dividendEast Asia & PacificEast Asia & Pacific (excluding high income)East Asia & Pacific (IDA & IBRD countries)EcuadorEgypt, Arab Rep.El SalvadorEquatorial GuineaEritreaEstoniaEthiopiaEuro areaEurope & Central AsiaEurope & Central Asia (excluding high income)Europe & Central Asia (IDA & IBRD countries)European UnionFaroe IslandsFijiFinlandFragile and conflict affected situationsFranceFrench PolynesiaGabonGambia, TheGeorgiaGermanyGhanaGibraltarGreeceGreenlandGrenadaGuatemalaGuineaGuinea-BissauGuyanaHaitiHigh incomeHondurasHong Kong SAR, ChinaHungaryIBRD onlyIcelandIDA & IBRD totalIDA blendIDA totalIndiaIndonesiaIran, Islamic Rep.IraqIrelandIsraelItalyJamaicaJapanJordanKazakhstanKenyaKiribatiKorea, Dem. People’s Rep.Korea, Rep.KuwaitKyrgyz RepublicLao PDRLate-demographic dividendLatin America & Caribbean Latin America & Caribbean (excluding high income)Latin America & the Caribbean (IDA & IBRD countries)LatviaLebanonLesothoLiberiaLibyaLiechtensteinLithuaniaLow & middle incomeLower middle incomeLuxembourgMacao SAR, ChinaMacedonia, FYRMadagascarMalawiMalaysiaMaldivesMaliMaltaMarshall IslandsMauritaniaMauritiusMexicoMicronesia, Fed. Sts.Middle East & North AfricaMiddle East & North Africa (excluding high income)Middle East & North Africa (IDA & IBRD countries)Middle incomeMoldovaMongoliaMontenegroMoroccoMozambiqueMyanmarNamibiaNauruNepalNetherlandsNew CaledoniaNew ZealandNicaraguaNigerNigeriaNorth AmericaNorwayOECD membersOmanPakistanPalauPanamaPapua New GuineaParaguayPeruPhilippinesPolandPortugalPost-demographic dividendPre-demographic dividendQatarRomaniaRussian FederationRwandaSamoaSao Tome and PrincipeSaudi ArabiaSenegalSerbiaSeychellesSierra LeoneSingaporeSint Maarten (Dutch part)Slovak RepublicSloveniaSolomon IslandsSomaliaSouth AfricaSouth AsiaSouth Asia (IDA & IBRD)South SudanSpainSri LankaSt. Kitts and NevisSt. LuciaSt. Vincent and the GrenadinesSub-Saharan Africa Sub-Saharan Africa (excluding high income)Sub-Saharan Africa (IDA & IBRD countries)SudanSurinameSwazilandSwedenSwitzerlandSyrian Arab RepublicTajikistanTanzaniaThailandTimor-LesteTogoTongaTrinidad and TobagoTunisiaTurkeyTurkmenistanTurks and Caicos IslandsUgandaUkraineUnited Arab EmiratesUnited KingdomUnited StatesUpper middle incomeUruguayUzbekistanVanuatuVenezuela, RBVietnamWest Bank and GazaWorldYemen, Rep.ZambiaZimbabwe Timeline:
This timeline shows a graph from 1961 to 2014 of High income. No data until 1960. Number of actual observations by date: 54.
Source name:
World Development Indicators
Source organization:
Carbon Dioxide Information Analysis Center, Environmental Sciences Division, Oak Ridge National Laboratory, Tennessee, United States.
Categories, topics:
Climate Change, Environment
Last updated:
apr 23, 2017
Indicators value changes by year
Minimum:
744.268K
jan 1, 1961
Maximum:
3.507 mln
jan 1, 2014
At the date of observation
Value
Absolute change
Change from previous value
jan 1, 1961
744.268K
+744.268K
0.0%
jan 1, 1962
757.54K
+13.272K
1.78%
jan 1, 1963
808.755K
+51.215K
6.76%
jan 1, 1964
853.973K
+45.218K
5.59%
jan 1, 1965
916.886K
+62.913K
7.37%
jan 1, 1966
952.352K
+35.466K
3.87%
jan 1, 1967
1.032 mln
+79.351K
8.33%
jan 1, 1968
1.091 mln
+59.041K
5.72%
jan 1, 1969
1.189 mln
+98.108K
8.99%
jan 1, 1970
1.305 mln
+116.224K
9.78%
jan 1, 1971
1.399 mln
+93.872K
7.19%
jan 1, 1972
1.489 mln
+90.339K
6.46%
jan 1, 1973
1.572 mln
+82.711K
5.55%
jan 1, 1974
1.599 mln
+26.91K
1.71%
jan 1, 1975
1.58 mln
-18.949K
-1.19%
jan 1, 1976
1.528 mln
-52.015K
-3.29%
jan 1, 1977
1.593 mln
+65.213K
4.27%
jan 1, 1978
1.579 mln
-14.513K
-0.91%
jan 1, 1979
1.636 mln
+57.514K
3.64%
jan 1, 1980
1.727 mln
+91.326K
5.58%
jan 1, 1981
1.754 mln
+26.615K
1.54%
jan 1, 1982
1.748 mln
-5.861K
-0.33%
jan 1, 1983
1.634 mln
-113.899K
-6.52%
jan 1, 1984
1.597 mln
-37.273K
-2.28%
jan 1, 1985
1.717 mln
+120.425K
7.54%
jan 1, 1986
1.739 mln
+21.436K
1.25%
jan 1, 1987
1.697 mln
-41.646K
-2.39%
jan 1, 1988
1.77 mln
+72.709K
4.28%
jan 1, 1989
1.843 mln
+72.913K
4.12%
jan 1, 1990
1.957 mln
+113.634K
6.17%
jan 1, 1991
2.069 mln
+112.665K
5.76%
jan 1, 1992
2.185 mln
+115.552K
5.58%
jan 1, 1993
2.231 mln
+45.978K
2.1%
jan 1, 1994
2.333 mln
+101.915K
4.57%
jan 1, 1995
2.394 mln
+61.272K
2.63%
jan 1, 1996
2.462 mln
+67.614K
2.82%
jan 1, 1997
2.571 mln
+109.96K
4.47%
jan 1, 1998
2.596 mln
+24.753K
0.96%
jan 1, 1999
2.612 mln
+15.589K
0.6%
jan 1, 2000
2.727 mln
+115.582K
4.43%
jan 1, 2001
2.849 mln
+121.725K
4.46%
jan 1, 2002
2.801 mln
-47.658K
-1.67%
jan 1, 2003
2.889 mln
+87.328K
3.12%
jan 1, 2004
2.928 mln
+38.878K
1.35%
jan 1, 2005
2.982 mln
+53.919K
1.84%
jan 1, 2006
3.018 mln
+36.683K
1.23%
jan 1, 2007
3.061 mln
+42.793K
1.42%
jan 1, 2008
3.174 mln
+113.037K
3.69%
jan 1, 2009
3.244 mln
+70.0K
2.21%
jan 1, 2010
3.168 mln
-76.01K
-2.34%
jan 1, 2011
3.38 mln
+212.095K
6.69%
jan 1, 2012
3.39 mln
+9.538K
0.28%
jan 1, 2013
3.468 mln
+78.72K
2.32%
jan 1, 2014
3.507 mln
+38.049K
1.1%
Ranking of countries by current statistics by years


Comments: